## Line Charts: Model Performance on Different Tasks
### Overview
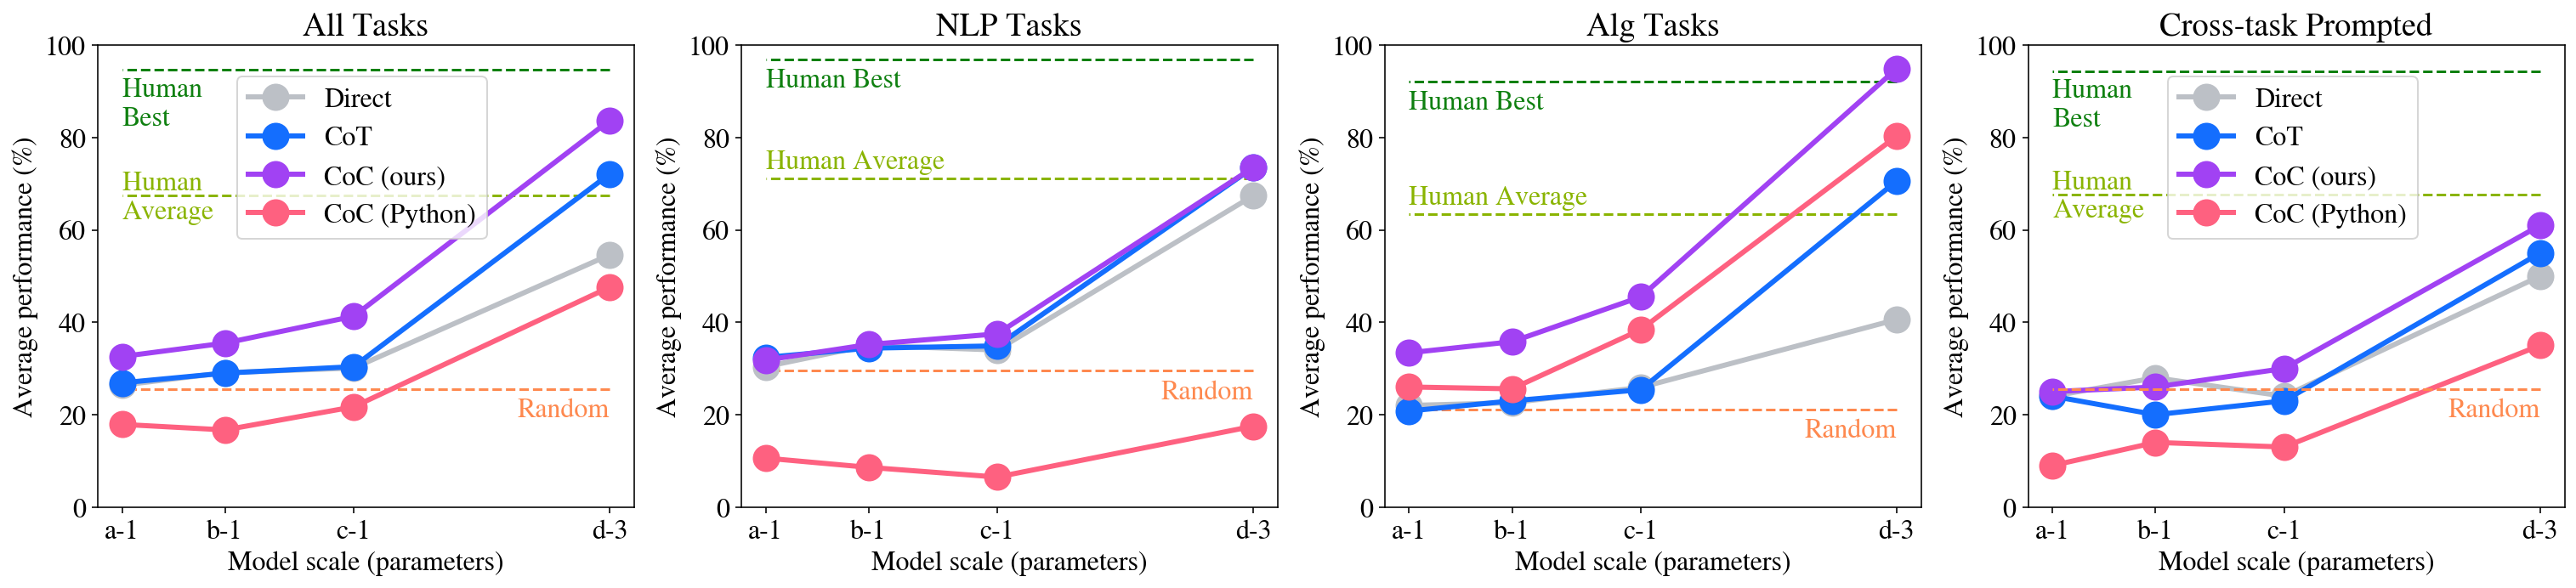
The image contains four line charts comparing the performance of different models (Direct, CoT, CoC (ours), and CoC (Python)) on four different task categories: All Tasks, NLP Tasks, Alg Tasks, and Cross-task Prompted. The x-axis represents the model scale (parameters), and the y-axis represents the average performance in percentage. Horizontal dashed lines indicate "Human Best", "Human Average", and "Random" performance levels.
### Components/Axes
* **Titles:**
* Top-left chart: "All Tasks"
* Top-middle-left chart: "NLP Tasks"
* Top-middle-right chart: "Alg Tasks"
* Top-right chart: "Cross-task Prompted"
* **X-axis:** "Model scale (parameters)" with markers: a-1, b-1, c-1, d-3
* **Y-axis:** "Average performance (%)" with markers: 0, 20, 40, 60, 80, 100
* **Horizontal Lines:**
* Green dashed line: "Human Best" (appears at approximately 92% on all charts)
* Olive dashed line: "Human Average" (appears at approximately 67% on all charts except the "All Tasks" chart, where it's at approximately 65%)
* Brown dashed line: "Random" (appears at approximately 25% on all charts)
* **Legend:** (Located in the top-right corner of the "All Tasks" chart, and implied to be the same for all charts)
* Gray: Direct
* Blue: CoT
* Purple: CoC (ours)
* Red: CoC (Python)
### Detailed Analysis
**1. All Tasks**
* **Direct (Gray):** Starts at approximately 33%, dips slightly to 32% at b-1, then increases to 42% at c-1, and reaches approximately 55% at d-3.
* **CoT (Blue):** Starts at approximately 27%, remains relatively stable at 27% at b-1, increases to 33% at c-1, and reaches approximately 52% at d-3.
* **CoC (ours) (Purple):** Starts at approximately 34%, increases to 38% at b-1, then increases to 48% at c-1, and reaches approximately 63% at d-3.
* **CoC (Python) (Red):** Starts at approximately 18%, decreases slightly to 17% at b-1, increases to 21% at c-1, and reaches approximately 48% at d-3.
**2. NLP Tasks**
* **Direct (Gray):** Starts at approximately 38%, increases to 48% at b-1, then increases to 50% at c-1, and reaches approximately 72% at d-3.
* **CoT (Blue):** Starts at approximately 33%, increases to 35% at b-1, then increases to 37% at c-1, and reaches approximately 71% at d-3.
* **CoC (ours) (Purple):** Starts at approximately 34%, increases to 35% at b-1, then increases to 38% at c-1, and reaches approximately 73% at d-3.
* **CoC (Python) (Red):** Starts at approximately 12%, decreases to 8% at b-1, then increases to 9% at c-1, and reaches approximately 17% at d-3.
**3. Alg Tasks**
* **Direct (Gray):** Starts at approximately 22%, remains relatively stable at 22% at b-1, then increases to 23% at c-1, and reaches approximately 40% at d-3.
* **CoT (Blue):** Starts at approximately 21%, increases slightly to 24% at b-1, then increases to 26% at c-1, and reaches approximately 70% at d-3.
* **CoC (ours) (Purple):** Starts at approximately 25%, increases to 45% at b-1, then increases to 50% at c-1, and reaches approximately 85% at d-3.
* **CoC (Python) (Red):** Starts at approximately 23%, increases to 48% at b-1, then increases to 65% at c-1, and reaches approximately 80% at d-3.
**4. Cross-task Prompted**
* **Direct (Gray):** Starts at approximately 27%, remains relatively stable at 27% at b-1, then increases to 30% at c-1, and reaches approximately 45% at d-3.
* **CoT (Blue):** Starts at approximately 20%, decreases slightly to 19% at b-1, then increases to 23% at c-1, and reaches approximately 55% at d-3.
* **CoC (ours) (Purple):** Starts at approximately 28%, increases to 28% at b-1, then increases to 38% at c-1, and reaches approximately 63% at d-3.
* **CoC (Python) (Red):** Starts at approximately 13%, decreases slightly to 12% at b-1, then increases to 14% at c-1, and reaches approximately 40% at d-3.
### Key Observations
* Across all task categories, the performance of all models generally increases as the model scale (parameters) increases from a-1 to d-3.
* The "Human Best" performance is consistently around 92% across all task categories.
* The "Human Average" performance varies slightly, being around 65% for "All Tasks" and around 67% for the other task categories.
* The "Random" performance is consistently around 25% across all task categories.
* CoC (ours) generally outperforms CoT and Direct across all tasks, especially at larger model scales.
* CoC (Python) shows varying performance depending on the task category. It performs poorly on NLP tasks but shows significant improvement on Alg tasks.
### Interpretation
The charts demonstrate the impact of model scale on the performance of different models across various task categories. The CoC (ours) model appears to be the most effective, consistently outperforming other models as the model scale increases. The CoC (Python) model's performance is highly task-dependent, suggesting it may be better suited for certain types of tasks (e.g., Alg tasks) than others (e.g., NLP tasks). The comparison with "Human Best," "Human Average," and "Random" performance levels provides a benchmark for evaluating the models' effectiveness. The data suggests that increasing model scale generally leads to improved performance, but the choice of model and task category significantly influences the overall results.