\n
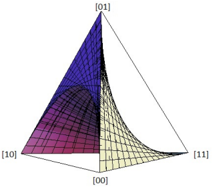
## 3D Surface Plot: Triangular Surface
### Overview
The image depicts a 3D surface plot resembling a triangular pyramid or cone. The surface is a mesh of grid lines, colored with a gradient transitioning from purple to yellow. The axes are labeled with coordinate pairs in square brackets.
### Components/Axes
* **X-axis:** Labeled "[10]" at the left base and "[11]" at the right base.
* **Y-axis:** Labeled "[00]" at the base.
* **Z-axis:** Implicitly represented by the height of the surface, with the apex labeled "[01]".
* **Surface:** A mesh of grid lines forming a curved surface. The surface is colored with a gradient: purple on the left side, transitioning to yellow on the right side.
### Detailed Analysis
The surface appears to be defined by a function of two variables, x and y, where x ranges approximately from 10 to 11 and y is fixed at 0. The height (z-value) of the surface increases from 0 at the base to a maximum at the apex [01].
The surface is divided into two distinct regions by a vertical plane. The left region (x values closer to 10) is colored purple, and the right region (x values closer to 11) is colored yellow. The gradient suggests a continuous change in the function's value as x changes.
The surface is not a simple cone or pyramid. It has a curvature that suggests a more complex mathematical function. The surface is highest at the apex [01] and decreases towards the base along both the x and y axes.
### Key Observations
* The surface is symmetrical about the y-axis.
* The color gradient indicates a change in the function's value along the x-axis.
* The surface is smooth and continuous, with no sharp edges or discontinuities.
* The apex of the surface is located at [01].
### Interpretation
The plot likely represents a mathematical function of two variables, possibly a quadratic or polynomial function. The triangular shape suggests that the function is constrained by the x and y axes. The color gradient could represent the value of the function, with purple indicating lower values and yellow indicating higher values.
The division of the surface into two regions by a vertical plane could indicate a discontinuity or a change in the function's behavior. Alternatively, it could be a visual representation of a boundary condition or a constraint on the function.
Without knowing the specific function that defines the surface, it is difficult to provide a more detailed interpretation. However, the plot suggests a relationship between the x and y variables and the height (z-value) of the surface. The shape and color gradient provide clues about the nature of this relationship. The plot could be used to visualize and analyze the behavior of the function, identify critical points, and explore its properties.