# Technical Document Extraction: Revision Model Verifier Performance
## 1. Document Metadata
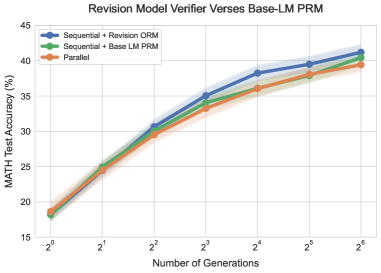
* **Title:** Revision Model Verifier Versus Base-LM PRM
* **Type:** Line Graph with Confidence Intervals
* **Language:** English
## 2. Component Isolation
### Header
* **Main Title:** "Revision Model Verifier Verses Base-LM PRM" (Note: "Verses" is a literal transcription of the typo in the image; intended meaning is "Versus").
### Main Chart Area
* **Y-Axis Label:** MATH Test Accuracy (%)
* **Y-Axis Scale:** Linear, ranging from 15 to 45 with increments of 5.
* **X-Axis Label:** Number of Generations
* **X-Axis Scale:** Logarithmic (base 2), markers at $2^0, 2^1, 2^2, 2^3, 2^4, 2^5, 2^6$.
* **Grid:** Major horizontal and vertical grid lines are present.
### Legend [Top-Left Placement]
* **Blue Line (Circle Marker):** Sequential + Revision ORM
* **Green Line (Circle Marker):** Sequential + Base LM PRM
* **Orange Line (Circle Marker):** Parallel
---
## 3. Data Series Analysis and Trend Verification
All three data series exhibit a logarithmic growth trend, where accuracy increases as the number of generations increases, but the rate of improvement slows down at higher generation counts.
### Series 1: Sequential + Revision ORM (Blue)
* **Visual Trend:** This series consistently maintains the highest accuracy across all data points from $2^2$ onwards. It shows the steepest improvement between $2^1$ and $2^4$.
* **Estimated Data Points:**
* $2^0$: ~18.5%
* $2^1$: ~24.5%
* $2^2$: ~30.5%
* $2^3$: ~35.0%
* $2^4$: ~38.0%
* $2^5$: ~39.5%
* $2^6$: ~41.0%
### Series 2: Sequential + Base LM PRM (Green)
* **Visual Trend:** This series performs similarly to the "Parallel" series at low generation counts but begins to outperform it slightly starting at $2^3$. It remains below the "Sequential + Revision ORM" throughout the mid-to-high range.
* **Estimated Data Points:**
* $2^0$: ~18.0%
* $2^1$: ~25.0%
* $2^2$: ~30.0%
* $2^3$: ~34.0%
* $2^4$: ~36.0%
* $2^5$: ~38.0%
* $2^6$: ~40.5%
### Series 3: Parallel (Orange)
* **Visual Trend:** This series generally represents the baseline performance. While it starts slightly higher than the others at $2^0$, it is overtaken by the Sequential models as generations increase, ending as the lowest-performing method at $2^6$.
* **Estimated Data Points:**
* $2^0$: ~18.8%
* $2^1$: ~24.5%
* $2^2$: ~29.5%
* $2^3$: ~33.5%
* $2^4$: ~36.0%
* $2^5$: ~38.0%
* $2^6$: ~39.5%
---
## 4. Summary of Findings
The chart demonstrates that "Sequential + Revision ORM" is the most effective method for increasing MATH test accuracy as the number of generations scales. At the maximum tested scale ($2^6$ generations), the Revision ORM achieves approximately 41% accuracy, outperforming the Base LM PRM (~40.5%) and the Parallel approach (~39.5%). Shaded regions around each line indicate confidence intervals, suggesting that the performance gap between the Revision ORM and the other methods is statistically significant starting around $2^3$ generations.