## Box Plot: Performance Comparison: mTPI2 - mTPI
### Overview
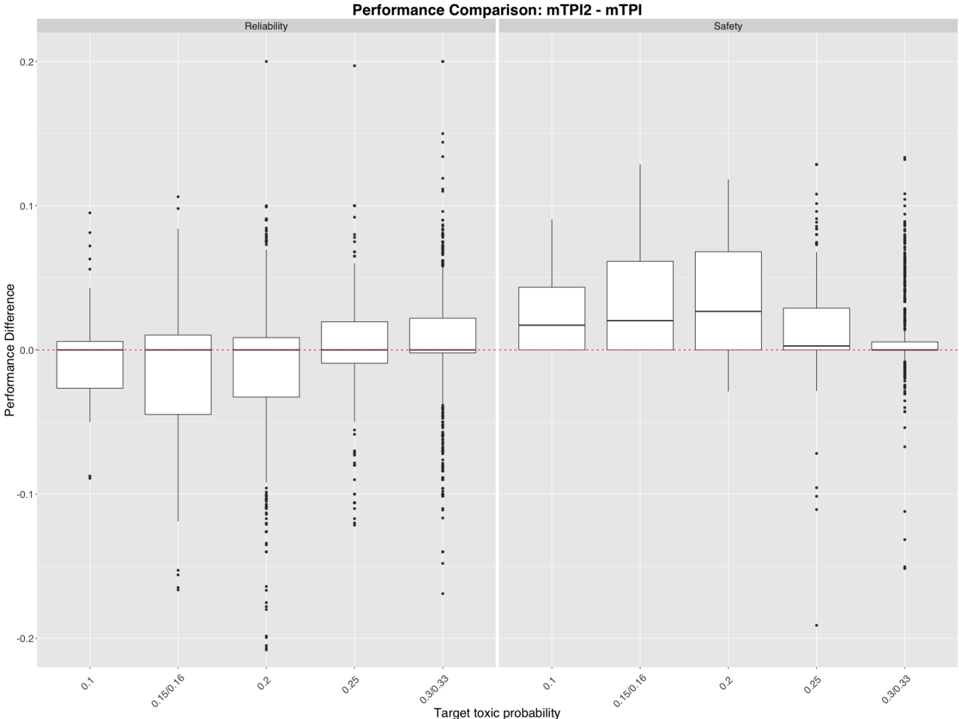
The image presents a comparative box plot analysis of performance differences between two models (mTPI2 and mTPI) across varying target toxic probabilities. The data is split into two categories: **Reliability** (left) and **Safety** (right). Performance differences are measured on a scale from -0.2 to 0.2, with a red dashed line at 0.0 indicating no difference. The x-axis categorizes data by target toxic probability ranges (0.1, 0.15/0.16, 0.2, 0.25, 0.3/0.33).
---
### Components/Axes
- **X-Axis**: Target toxic probability (categorical bins: 0.1, 0.15/0.16, 0.2, 0.25, 0.3/0.33).
- **Y-Axis**: Performance Difference (continuous scale from -0.2 to 0.2).
- **Legend**:
- **Reliability**: Gray (left section).
- **Safety**: Black (right section).
- **Red Dashed Line**: Baseline at 0.0 performance difference.
---
### Detailed Analysis
#### Reliability (Left Section)
- **0.1**: Median ~-0.05, interquartile range (IQR) spans -0.05 to -0.01. Outliers at ~-0.15 and ~0.05.
- **0.15/0.16**: Median ~-0.03, IQR spans -0.08 to -0.01. Outliers at ~-0.18 and ~0.02.
- **0.2**: Median ~-0.02, IQR spans -0.06 to 0.01. Outliers at ~-0.12 and ~0.08.
- **0.25**: Median ~-0.01, IQR spans -0.04 to 0.02. Outliers at ~-0.15 and ~0.1.
- **0.3/0.33**: Median ~-0.01, IQR spans -0.03 to 0.01. Outliers at ~-0.18 and ~0.05.
#### Safety (Right Section)
- **0.1**: Median ~0.03, IQR spans 0.01 to 0.05. Outliers at ~-0.05 and ~0.12.
- **0.15/0.16**: Median ~0.05, IQR spans 0.03 to 0.08. Outliers at ~-0.02 and ~0.15.
- **0.2**: Median ~0.06, IQR spans 0.04 to 0.1. Outliers at ~-0.03 and ~0.18.
- **0.25**: Median ~0.04, IQR spans 0.02 to 0.07. Outliers at ~-0.05 and ~0.12.
- **0.3/0.33**: Median ~0.02, IQR spans 0.01 to 0.04. Outliers at ~-0.08 and ~0.15.
---
### Key Observations
1. **Reliability Trends**:
- Performance differences are predominantly negative (below 0.0) across all target toxic probabilities.
- Median values cluster near -0.01 to -0.05, with increasing variability (wider IQRs) at higher toxicity targets (e.g., 0.25 and 0.3/0.33).
- Outliers suggest occasional positive performance differences, but these are rare.
2. **Safety Trends**:
- Performance differences are predominantly positive (above 0.0) across all ranges.
- Median values increase slightly with higher toxicity targets (e.g., 0.2 has the highest median at ~0.06).
- Safety shows greater variability at higher toxicity targets (e.g., 0.25 and 0.3/0.33 have wider IQRs).
3. **Outliers**:
- Reliability outliers below -0.15 and above 0.05 are sparse but notable.
- Safety outliers below -0.05 and above 0.15 indicate rare deviations from the trend.
---
### Interpretation
- **Model Behavior**:
- mTPI2 underperforms mTPI in **Reliability** across most scenarios, with performance differences worsening as target toxic probability increases. This suggests mTPI2 may struggle with consistency in high-stakes or ambiguous contexts.
- In **Safety**, mTPI2 generally outperforms mTPI, with performance differences peaking at 0.2. However, the widening IQRs at higher toxicity targets imply increased unpredictability in extreme cases.
- **Design Implications**:
- The divergence in trends between Reliability and Safety highlights a trade-off: optimizing for safety may come at the cost of reliability, and vice versa.
- Outliers in both categories warrant investigation to determine if they represent edge cases or systemic issues in specific toxicity ranges.
- **Limitations**:
- The box plots do not specify the direction of performance differences (e.g., whether mTPI2 is faster, more accurate, or less resource-intensive than mTPI).
- The absence of statistical significance markers (e.g., p-values) makes it unclear whether differences are meaningful or due to random variation.
---
### Spatial Grounding
- **Legend**: Top-center, clearly labeling Reliability (gray) and Safety (black).
- **Red Dashed Line**: Horizontally centered at 0.0, dividing positive and negative performance differences.
- **Box Plots**: Aligned vertically under each x-axis category, with Reliability on the left and Safety on the right.
---
### Content Details
- **Reliability**:
- Median values: -0.05 (0.1), -0.03 (0.15/0.16), -0.02 (0.2), -0.01 (0.25), -0.01 (0.3/0.33).
- Outliers: -0.15, -0.18, -0.12, -0.15, -0.18 (negative); 0.05, 0.02, 0.08, 0.1, 0.05 (positive).
- **Safety**:
- Median values: 0.03 (0.1), 0.05 (0.15/0.16), 0.06 (0.2), 0.04 (0.25), 0.02 (0.3/0.33).
- Outliers: -0.05, -0.02, -0.03, -0.05, -0.08 (negative); 0.12, 0.15, 0.18, 0.12, 0.15 (positive).
---
### Final Notes
The data underscores a critical tension between Reliability and Safety in model performance. While mTPI2 shows promise in Safety, its Reliability lags behind mTPI, particularly in high-toxicity scenarios. Further analysis is needed to quantify the trade-offs and explore mitigation strategies.