## Chat Log Analysis: Total Agents Over Time vs. HITL Rate Charts
### Overview
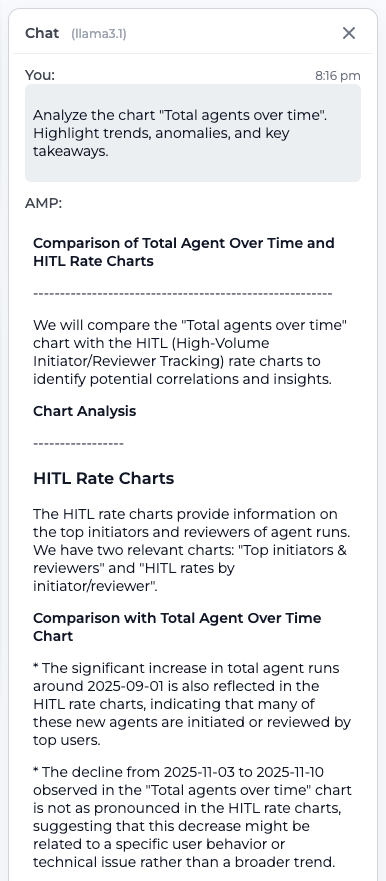
The image presents a chat log where a user requests an analysis of a "Total agents over time" chart, focusing on trends, anomalies, and key takeaways. The response compares this chart with HITL (High-Volume Initiator/Reviewer Tracking) rate charts to identify potential correlations and insights. The analysis highlights a significant increase in total agent runs around 2025-09-01, reflected in the HITL rate charts, and a less pronounced decline from 2025-11-03 to 2025-11-10 in the HITL rate charts compared to the "Total agents over time" chart.
### Components/Axes
* **Chat Header:** "Chat (llama3.1)"
* **Timestamp:** "8:16 pm"
* **User Request:** Analyze the chart "Total agents over time". Highlight trends, anomalies, and key takeaways.
* **Response Header:** "AMP:"
* **Comparison Title:** "Comparison of Total Agent Over Time and HITL Rate Charts"
* **Chart Analysis Title:** "Chart Analysis"
* **HITL Rate Charts Title:** "HITL Rate Charts"
* **HITL Rate Charts Description:** The HITL rate charts provide information on the top initiators and reviewers of agent runs. We have two relevant charts: "Top initiators & reviewers" and "HITL rates by initiator/reviewer".
* **Comparison with Total Agent Over Time Chart:**
* The significant increase in total agent runs around 2025-09-01 is also reflected in the HITL rate charts, indicating that many of these new agents are initiated or reviewed by top users.
* The decline from 2025-11-03 to 2025-11-10 observed in the "Total agents over time" chart is not as pronounced in the HITL rate charts, suggesting that this decrease might be related to a specific user behavior or technical issue rather than a broader trend.
### Detailed Analysis or Content Details
The analysis focuses on two key periods:
1. **Around 2025-09-01:** A significant increase in total agent runs is observed and is reflected in the HITL rate charts. This suggests that many new agents are being initiated or reviewed by top users.
2. **From 2025-11-03 to 2025-11-10:** A decline is observed in the "Total agents over time" chart, but this decline is less pronounced in the HITL rate charts. This suggests that the decrease might be related to a specific user behavior or technical issue rather than a broader trend.
### Key Observations
* The analysis correlates trends in the "Total agents over time" chart with the HITL rate charts.
* The increase around 2025-09-01 is attributed to new agents being initiated or reviewed by top users.
* The decline from 2025-11-03 to 2025-11-10 is potentially linked to specific user behavior or technical issues.
### Interpretation
The analysis suggests a relationship between the total number of agents and the activity of top initiators/reviewers. The increase in agent runs around 2025-09-01 indicates that top users are actively involved in initiating or reviewing new agents. The less pronounced decline in HITL rates during the 2025-11-03 to 2025-11-10 period, despite a decline in total agents, suggests that the decrease in total agents might not be directly related to the activity of top initiators/reviewers, and could be due to other factors like user behavior or technical issues. This highlights the importance of considering multiple factors when analyzing trends in agent activity.