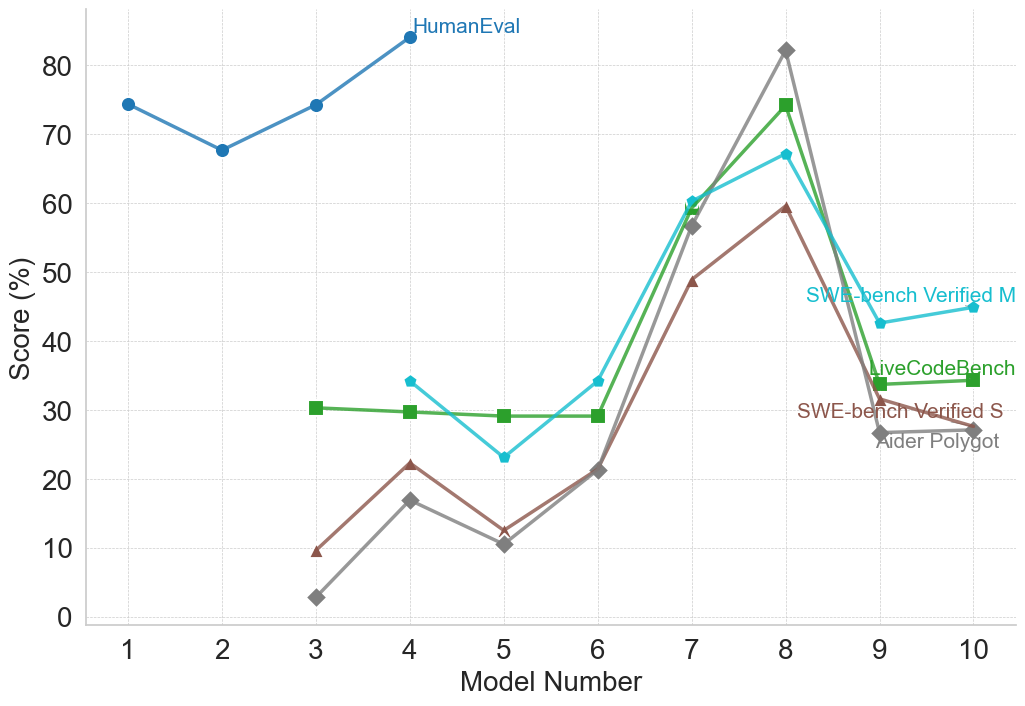
## Line Chart: Model Performance Across Multiple Coding Benchmarks
### Overview
The image displays a line chart comparing the performance scores (in percentage) of ten different models (labeled 1 through 10) across five distinct coding benchmarks. The chart illustrates how model capabilities vary significantly depending on the specific evaluation task.
### Components/Axes
* **X-Axis:** Labeled "Model Number". It has discrete integer markers from 1 to 10.
* **Y-Axis:** Labeled "Score (%)". It has a linear scale from 0 to 80, with major gridlines at intervals of 10.
* **Legend:** Positioned in the top-right quadrant of the chart area. It contains five entries, each with a colored line and marker symbol:
* **HumanEval:** Blue line with circle markers.
* **SWE-bench Verified M:** Cyan line with diamond markers.
* **LiveCodeBench:** Green line with square markers.
* **SWE-bench Verified S:** Brown line with triangle markers.
* **Aider Polyglot:** Gray line with diamond markers.
* **Data Series:** Five distinct lines plot the score for each model on each benchmark. Not all models have data for all benchmarks.
### Detailed Analysis
**1. HumanEval (Blue, Circles):**
* **Trend:** Starts high, dips slightly, then rises to an early peak before data ends.
* **Data Points (Approximate):**
* Model 1: ~74%
* Model 2: ~68%
* Model 3: ~74%
* Model 4: ~84% (Peak for this series)
* *Data for models 5-10 is not plotted for this benchmark.*
**2. SWE-bench Verified M (Cyan, Diamonds):**
* **Trend:** Starts moderate, dips, then rises sharply to a peak at model 8 before declining.
* **Data Points (Approximate):**
* Model 4: ~34%
* Model 5: ~23%
* Model 6: ~34%
* Model 7: ~60%
* Model 8: ~67% (Peak for this series)
* Model 9: ~43%
* Model 10: ~45%
**3. LiveCodeBench (Green, Squares):**
* **Trend:** Remains relatively flat and low for early models, then spikes dramatically at model 8 before dropping.
* **Data Points (Approximate):**
* Model 3: ~30%
* Model 4: ~30%
* Model 5: ~29%
* Model 6: ~29%
* Model 7: ~59%
* Model 8: ~74% (Peak for this series)
* Model 9: ~34%
* Model 10: ~34%
**4. SWE-bench Verified S (Brown, Triangles):**
* **Trend:** Starts very low, shows a general upward trend to a peak at model 8, then declines.
* **Data Points (Approximate):**
* Model 3: ~10%
* Model 4: ~22%
* Model 5: ~12%
* Model 6: ~21%
* Model 7: ~49%
* Model 8: ~59% (Peak for this series)
* Model 9: ~27%
* Model 10: ~27%
**5. Aider Polyglot (Gray, Diamonds):**
* **Trend:** Starts the lowest, follows a similar shape to SWE-bench Verified S, peaking highest of all series at model 8.
* **Data Points (Approximate):**
* Model 3: ~3%
* Model 4: ~17%
* Model 5: ~10%
* Model 6: ~21%
* Model 7: ~57%
* Model 8: ~82% (Highest score on the entire chart)
* Model 9: ~26%
* Model 10: ~27%
### Key Observations
1. **Universal Peak at Model 8:** All five benchmarks show their highest or near-highest score for Model 8. This model is the clear standout performer across this diverse set of tasks.
2. **Benchmark Difficulty Hierarchy:** There is a clear stratification. HumanEval appears to be the "easiest" benchmark (scores consistently above 65% for the models tested). The SWE-bench variants and Aider Polyglot are significantly more challenging, with scores often below 30% for earlier models.
3. **Performance Clustering:** Models 9 and 10 show a marked decline from the Model 8 peak across all applicable benchmarks, clustering around similar, lower scores (25-45% range).
4. **Divergent Early Performance:** For models 3-6, performance on different benchmarks is highly variable. A model could score ~30% on LiveCodeBench but only ~10% on Aider Polyglot (e.g., Model 3), indicating specialized rather than general capabilities.
### Interpretation
This chart demonstrates that "model performance" is not a single metric but is highly dependent on the evaluation benchmark. The data suggests:
* **Model 8 represents a significant capability leap** across a wide spectrum of coding tasks, from function generation (HumanEval) to more complex software engineering and polyglot challenges.
* **The benchmarks measure different skills.** The large gap between HumanEval scores and the others implies that generating isolated functions is a more solved problem than the tasks required by SWE-bench (likely involving codebase interaction, debugging, and implementation) or Aider Polyglot (multi-language proficiency).
* **There may be a trade-off or specialization axis.** The models preceding Model 8 show inconsistent rankings across benchmarks, suggesting they may be optimized for different types of tasks. Model 8 appears to break this trend, achieving strong generalization.
* **The drop after Model 8 is notable.** It could indicate that Models 9 and 10 are earlier, less capable versions, or perhaps they are specialized for tasks not measured by these five benchmarks. Without model names, this remains speculative.
In essence, the chart argues for the necessity of multi-benchmark evaluation to understand the true profile of a coding AI model, as strengths in one area (e.g., HumanEval) do not guarantee strength in others (e.g., SWE-bench). Model 8 emerges as the most robust generalist in this specific comparison.