\n
## Violin Plot: Reliance Sensitivity Comparison
### Overview
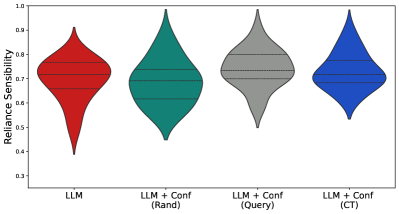
The image presents a violin plot comparing the "Reliance Sensitivity" across four different conditions: "LLM", "LLM + Conf (Rand)", "LLM + Conf (Query)", and "LLM + Conf (CT)". The violin plots visualize the distribution of reliance sensitivity for each condition, showing the median, interquartile range, and overall spread of the data.
### Components/Axes
* **X-axis:** Represents the four conditions: "LLM", "LLM + Conf (Rand)", "LLM + Conf (Query)", and "LLM + Conf (CT)".
* **Y-axis:** Labeled "Reliance Sensitivity", with a scale ranging from approximately 0.3 to 1.0.
* **Violin Plots:** Each condition is represented by a violin plot, displaying the distribution of reliance sensitivity values.
* **Colors:**
* LLM: Red
* LLM + Conf (Rand): Teal/Green
* LLM + Conf (Query): Gray
* LLM + Conf (CT): Blue
### Detailed Analysis
* **LLM (Red):** The violin plot is widest at the top, tapering down. The median is around 0.85. The distribution is relatively spread out, with values ranging from approximately 0.4 to 0.95.
* **LLM + Conf (Rand) (Teal/Green):** This plot is narrower than the LLM plot, with a median around 0.88. The distribution is more concentrated, ranging from approximately 0.6 to 0.98.
* **LLM + Conf (Query) (Gray):** This plot is similar in width to the LLM + Conf (Rand) plot, with a median around 0.78. The distribution ranges from approximately 0.55 to 0.95.
* **LLM + Conf (CT) (Blue):** This plot is the narrowest of the four, indicating the most concentrated distribution. The median is around 0.82. The distribution ranges from approximately 0.65 to 0.95.
### Key Observations
* The LLM condition exhibits the widest distribution of reliance sensitivity, suggesting the greatest variability in reliance when using the LLM alone.
* Adding confidence information (Conf) generally narrows the distribution, indicating more consistent reliance sensitivity.
* LLM + Conf (Rand) has the highest median reliance sensitivity.
* LLM + Conf (Query) has the lowest median reliance sensitivity.
* The LLM + Conf (CT) condition shows a relatively tight distribution around a median value.
### Interpretation
The data suggests that incorporating confidence information alongside the LLM output influences reliance sensitivity. The varying methods for generating confidence information ("Rand", "Query", "CT") lead to different distributions of reliance. The "Rand" method appears to increase reliance sensitivity compared to the LLM alone, while the "Query" method seems to decrease it. The "CT" method results in a more focused distribution, suggesting a more consistent level of reliance.
The wider distribution for the LLM alone indicates that users may vary significantly in how much they rely on the LLM's output without additional information. The narrowing of distributions with confidence information suggests that providing users with a measure of confidence helps to standardize their reliance behavior. The differences between the confidence methods ("Rand", "Query", "CT") likely reflect the quality or relevance of the confidence scores generated by each method. Further investigation would be needed to understand why the "Rand" method leads to higher reliance and the "Query" method leads to lower reliance.