\n
## Diagram: Causal Inference and Learning Agent
### Overview
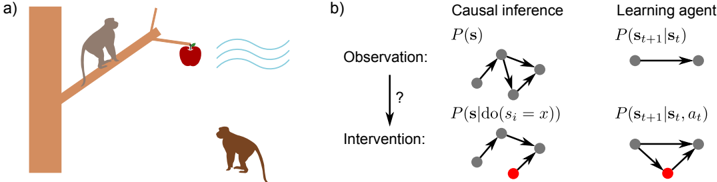
The image presents a two-part diagram. Part (a) depicts a scenario with a monkey attempting to reach an apple suspended by a string. Part (b) illustrates the concepts of causal inference and a learning agent using graphical models. The diagram aims to visually connect a real-world problem (monkey reaching for an apple) with abstract concepts in machine learning and causal reasoning.
### Components/Axes
**Part (a):**
* **Elements:** A brown tree trunk, a branch, two monkeys (one on the branch, one on the ground), a string, an apple, wavy lines representing wind or movement.
* **Spatial Arrangement:** The monkey on the branch is reaching for the apple. The monkey on the ground is looking up. The apple is suspended by a string.
**Part (b):**
* **Sections:** Divided into two columns: "Causal Inference" and "Learning Agent". Each column has two rows: "Observation" and "Intervention".
* **Graphical Models:** Each section contains a graphical model represented by nodes (grey circles) and edges (lines connecting the nodes). One node in the "Intervention" section of the "Causal Inference" column is colored red.
* **Labels:**
* "Causal inference"
* "Learning agent"
* "Observation:"
* "Intervention:"
* "P(s)"
* "P(s | do(s₁ = x))"
* "P(sₜ₊₁ | sₜ)"
* "P(sₜ₊₁ | sₜ, aₜ)"
* A question mark ("?") between "Observation" and "Intervention" in the "Causal Inference" column.
### Detailed Analysis or Content Details
**Part (a):**
This section is a visual representation of a problem. There are no numerical values or specific data points. It depicts a monkey attempting to obtain an apple, potentially influenced by external factors like wind.
**Part (b):**
**Causal Inference Column:**
* **Observation:** The top graph shows a network of interconnected nodes (grey circles). The connections represent relationships between variables. The label "P(s)" is above this graph, likely representing the probability distribution of a state 's'.
* **Intervention:** The bottom graph shows a similar network, but with one node colored red. The label "P(s | do(s₁ = x))" is above this graph, indicating a probability distribution conditioned on an intervention where variable s₁ is set to x. The red node likely represents the variable being intervened upon.
**Learning Agent Column:**
* **Observation:** The top graph shows two nodes connected by a double-headed arrow. The label "P(sₜ₊₁ | sₜ)" is above this graph, representing the probability of the next state (sₜ₊₁) given the current state (sₜ).
* **Intervention:** The bottom graph shows three nodes connected in a triangular fashion. The label "P(sₜ₊₁ | sₜ, aₜ)" is above this graph, representing the probability of the next state (sₜ₊₁) given the current state (sₜ) and an action (aₜ).
### Key Observations
* The "Causal Inference" section uses graphical models to represent the concepts of observation and intervention. The red node in the "Intervention" graph highlights the variable being manipulated.
* The "Learning Agent" section uses graphical models to represent the transition probabilities in a Markov Decision Process (MDP). The inclusion of 'aₜ' (action) in the second graph indicates that the agent's actions influence the state transitions.
* The question mark in the "Causal Inference" section suggests a query or unknown relationship between observation and intervention.
* The diagram visually connects the real-world scenario in part (a) with the abstract concepts in part (b). The monkey's attempt to reach the apple can be seen as an intervention in a causal system.
### Interpretation
The diagram illustrates the relationship between causal inference and reinforcement learning. The monkey-apple scenario serves as an intuitive example of a problem that can be modeled using causal graphs and solved by a learning agent.
The "Causal Inference" section demonstrates how to reason about the effects of interventions in a system. By manipulating a variable (the red node), we can observe how it affects other variables.
The "Learning Agent" section shows how an agent can learn to make optimal decisions in an environment. The agent learns a policy that maps states to actions, maximizing its reward.
The diagram suggests that causal inference can be used to improve the performance of learning agents. By understanding the causal relationships in an environment, an agent can make more informed decisions and achieve better outcomes. The question mark highlights the challenge of identifying these causal relationships. The diagram is a conceptual illustration rather than a presentation of specific data. It aims to convey the underlying principles of causal reasoning and reinforcement learning.