## Network Graph: Unlabeled Network Visualization
### Overview
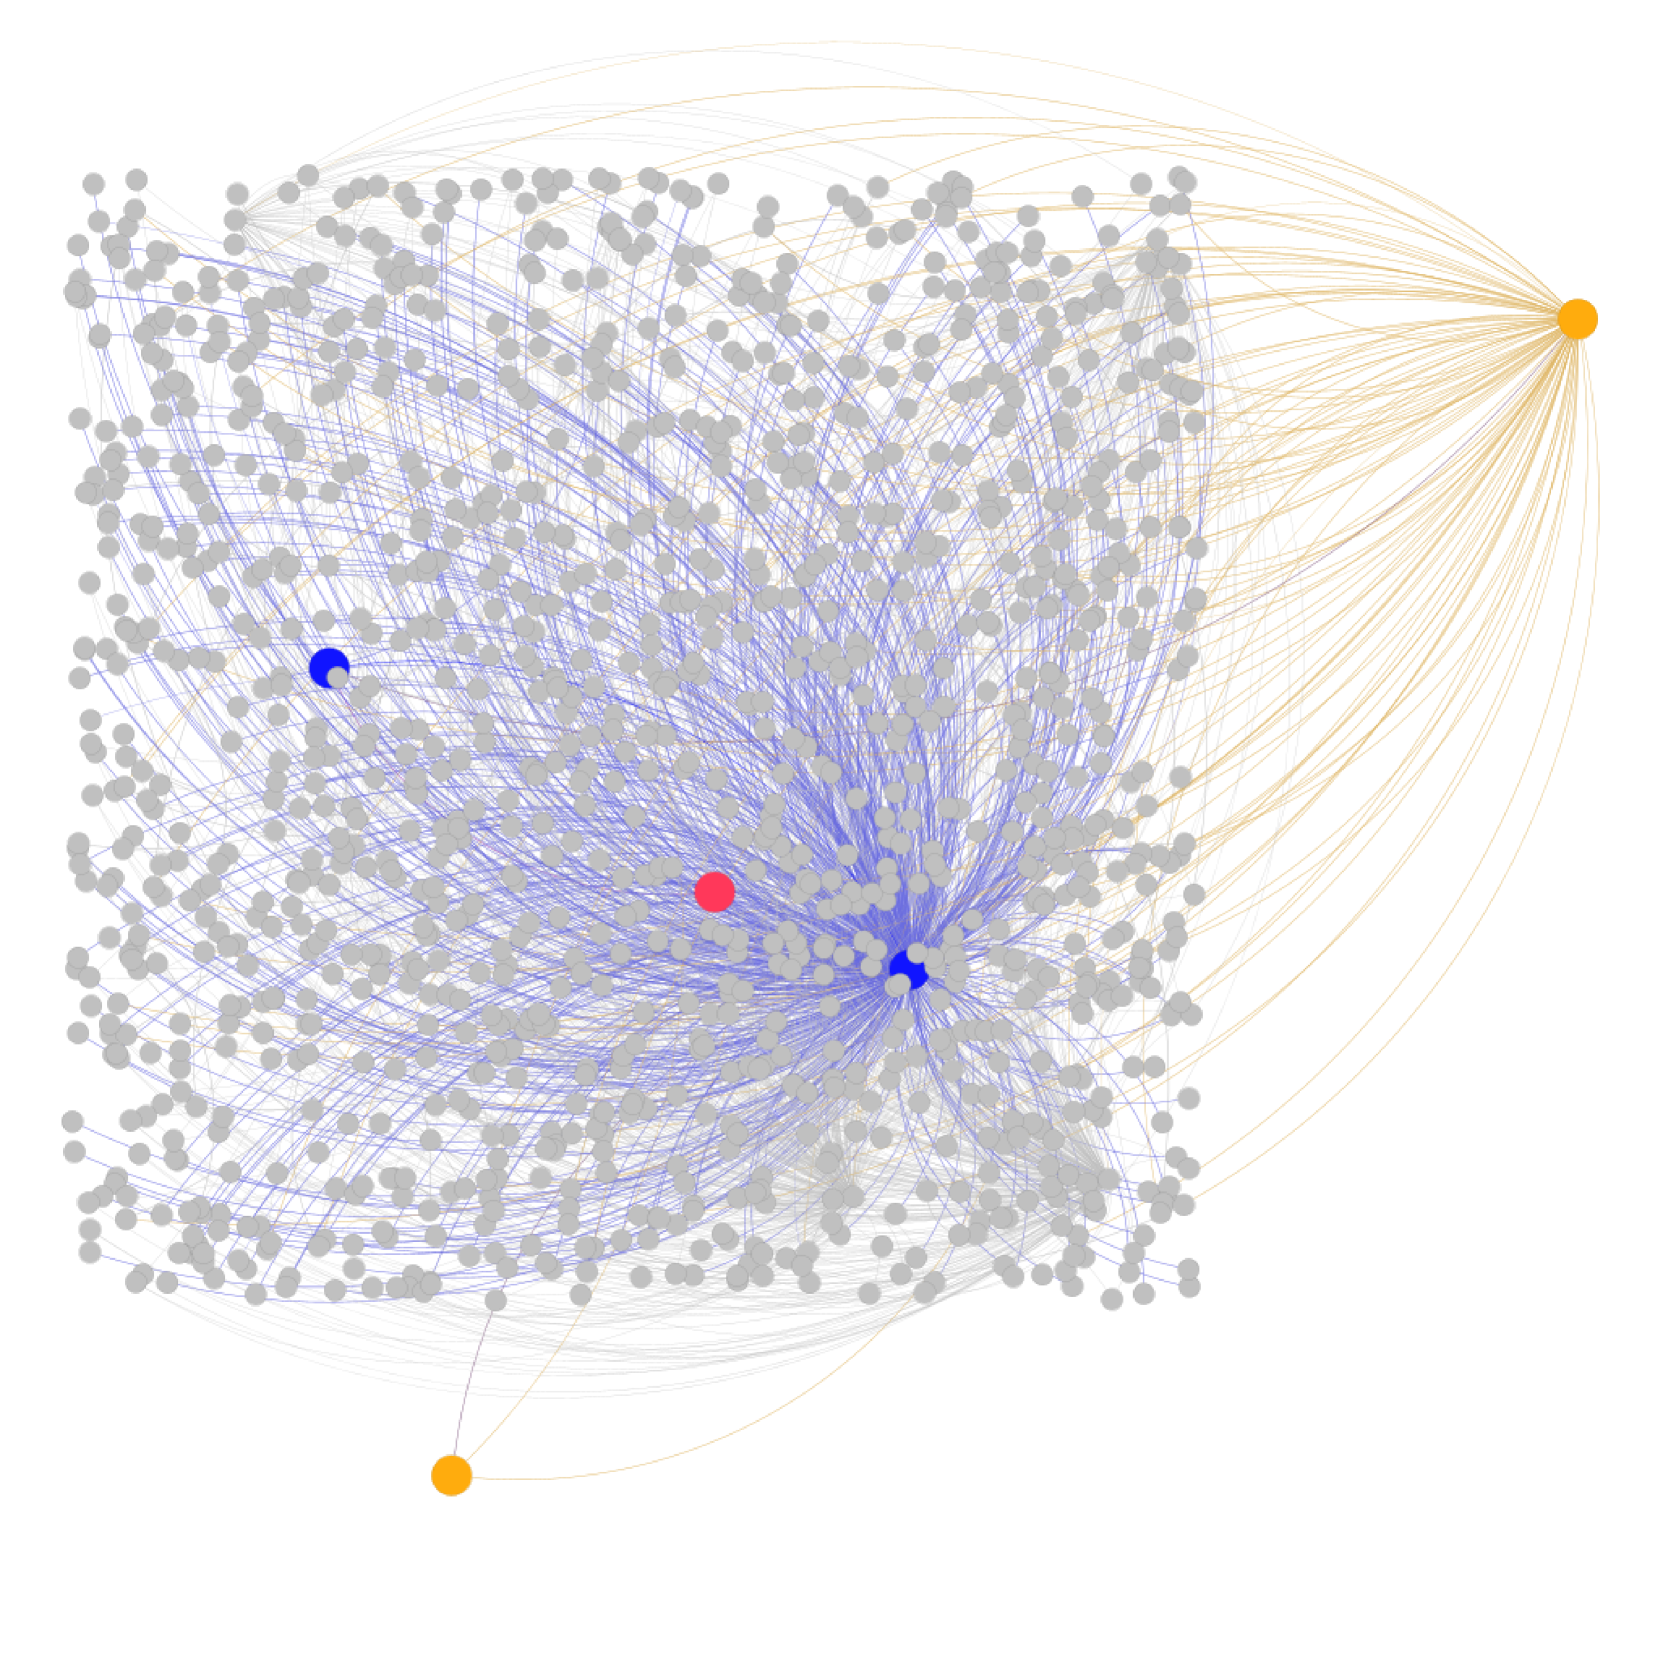
The image displays a network graph with a large number of nodes and edges. The nodes are colored in three distinct categories: grey, blue, and orange. The edges, representing connections between nodes, are also colored, primarily in blue and a lighter shade of orange/tan. The graph appears to be a visualization of relationships or connections within a system, with some nodes acting as central hubs or outliers. There are no explicit labels, titles, or legends present in the image.
### Components/Axes
* **Nodes:**
* **Grey Nodes:** The most numerous type of node, appearing in a dense cluster towards the left and center of the image. They are interconnected by blue and some tan edges.
* **Blue Nodes:** Two prominent blue nodes are visible. One is located within the dense cluster of grey nodes, appearing to be a central point for many blue edges. The second blue node is positioned further to the left and slightly above the main cluster.
* **Orange Nodes:** Two orange nodes are present. One is located in the far right of the image, acting as a focal point for a large number of tan edges. The second orange node is situated in the bottom-left corner, connected by a single tan edge to the main cluster of grey nodes.
* **Edges:**
* **Blue Edges:** These edges predominantly connect the grey nodes to each other and to the central blue node. They form a dense, fan-like structure emanating from the central blue node.
* **Tan/Orange Edges:** These edges connect the grey nodes to the orange node on the far right, and also connect the grey nodes to the orange node in the bottom-left. The edges connecting to the right orange node are numerous and spread out.
* **Axes/Scales:** There are no visible axes, scales, or grid lines. The positioning of nodes and edges is relative to each other within the image canvas.
### Detailed Analysis or Content Details
Due to the absence of labels and scales, precise numerical data extraction is not possible. However, visual estimations can be made:
* **Number of Nodes:**
* Grey Nodes: Estimated to be in the range of 1000-1500 nodes.
* Blue Nodes: 2 nodes.
* Orange Nodes: 2 nodes.
* **Number of Edges:**
* Blue Edges: A very large number, likely in the thousands, primarily originating from or connecting to the central blue node and the grey nodes.
* Tan/Orange Edges: A significant number, particularly those connecting to the orange node on the right, also likely in the thousands. The edges connecting to the bottom-left orange node are fewer, perhaps in the tens.
* **Node Distribution:**
* The majority of grey nodes are concentrated in a dense cluster in the left and central regions of the image.
* The central blue node is positioned within this dense cluster, suggesting it is a highly connected node within this group.
* The orange node on the right is an outlier, with a large number of connections radiating towards it from the main cluster.
* The orange node on the bottom-left is also an outlier, with fewer connections.
* **Edge Density:**
* The area around the central blue node and the grey nodes exhibits high edge density, indicating many interconnections.
* The connections to the right orange node are also dense, forming a distinct visual pattern.
### Key Observations
* **Centralization:** The network appears to have at least two potential central points: the central blue node, which is a hub for blue edges and grey nodes, and the orange node on the right, which is a hub for tan edges and grey nodes.
* **Clustering:** A significant cluster of grey nodes exists, suggesting a cohesive group or community within the network.
* **Outliers:** The two orange nodes, particularly the one on the far right, act as significant outliers, drawing connections from the main cluster. The bottom-left orange node is also an outlier but with fewer connections.
* **Color-Coded Relationships:** The distinct colors of nodes and edges suggest different types of entities or relationships. Blue edges and nodes might represent one category of interaction, while tan/orange edges and nodes represent another. The grey nodes appear to be a common element interacting with both.
### Interpretation
This network graph visualizes a system with distinct components and relationships. The presence of multiple colored nodes and edges suggests a classification of entities and their interactions.
The dense cluster of grey nodes, interconnected by blue edges and also linked to a central blue node, indicates a primary group or community where internal connections are prevalent, and the blue node might represent a key influencer, server, or focal point within this group.
The orange node on the right, with its numerous radiating tan edges connecting to the grey nodes, suggests it is a significant external entity or service that interacts with a large portion of the primary group. This could represent a popular platform, a widely used resource, or a central point of dissemination for information or services.
The orange node in the bottom-left, while also an outlier, has far fewer connections. This might represent a less influential external entity, a niche service, or a node with a specific, limited role.
The overall structure suggests a system where a core group (grey nodes) is influenced or connected to distinct external entities (blue and orange nodes) in varying degrees. The visualization could be used to understand network topology, identify central actors, analyze community structures, or map the flow of information or resources within a complex system. Without labels, the specific domain or meaning of these nodes and edges remains speculative, but the visual patterns strongly imply a structured set of relationships.