## Network Diagram: Dense Cluster with Peripheral Hubs
### Overview
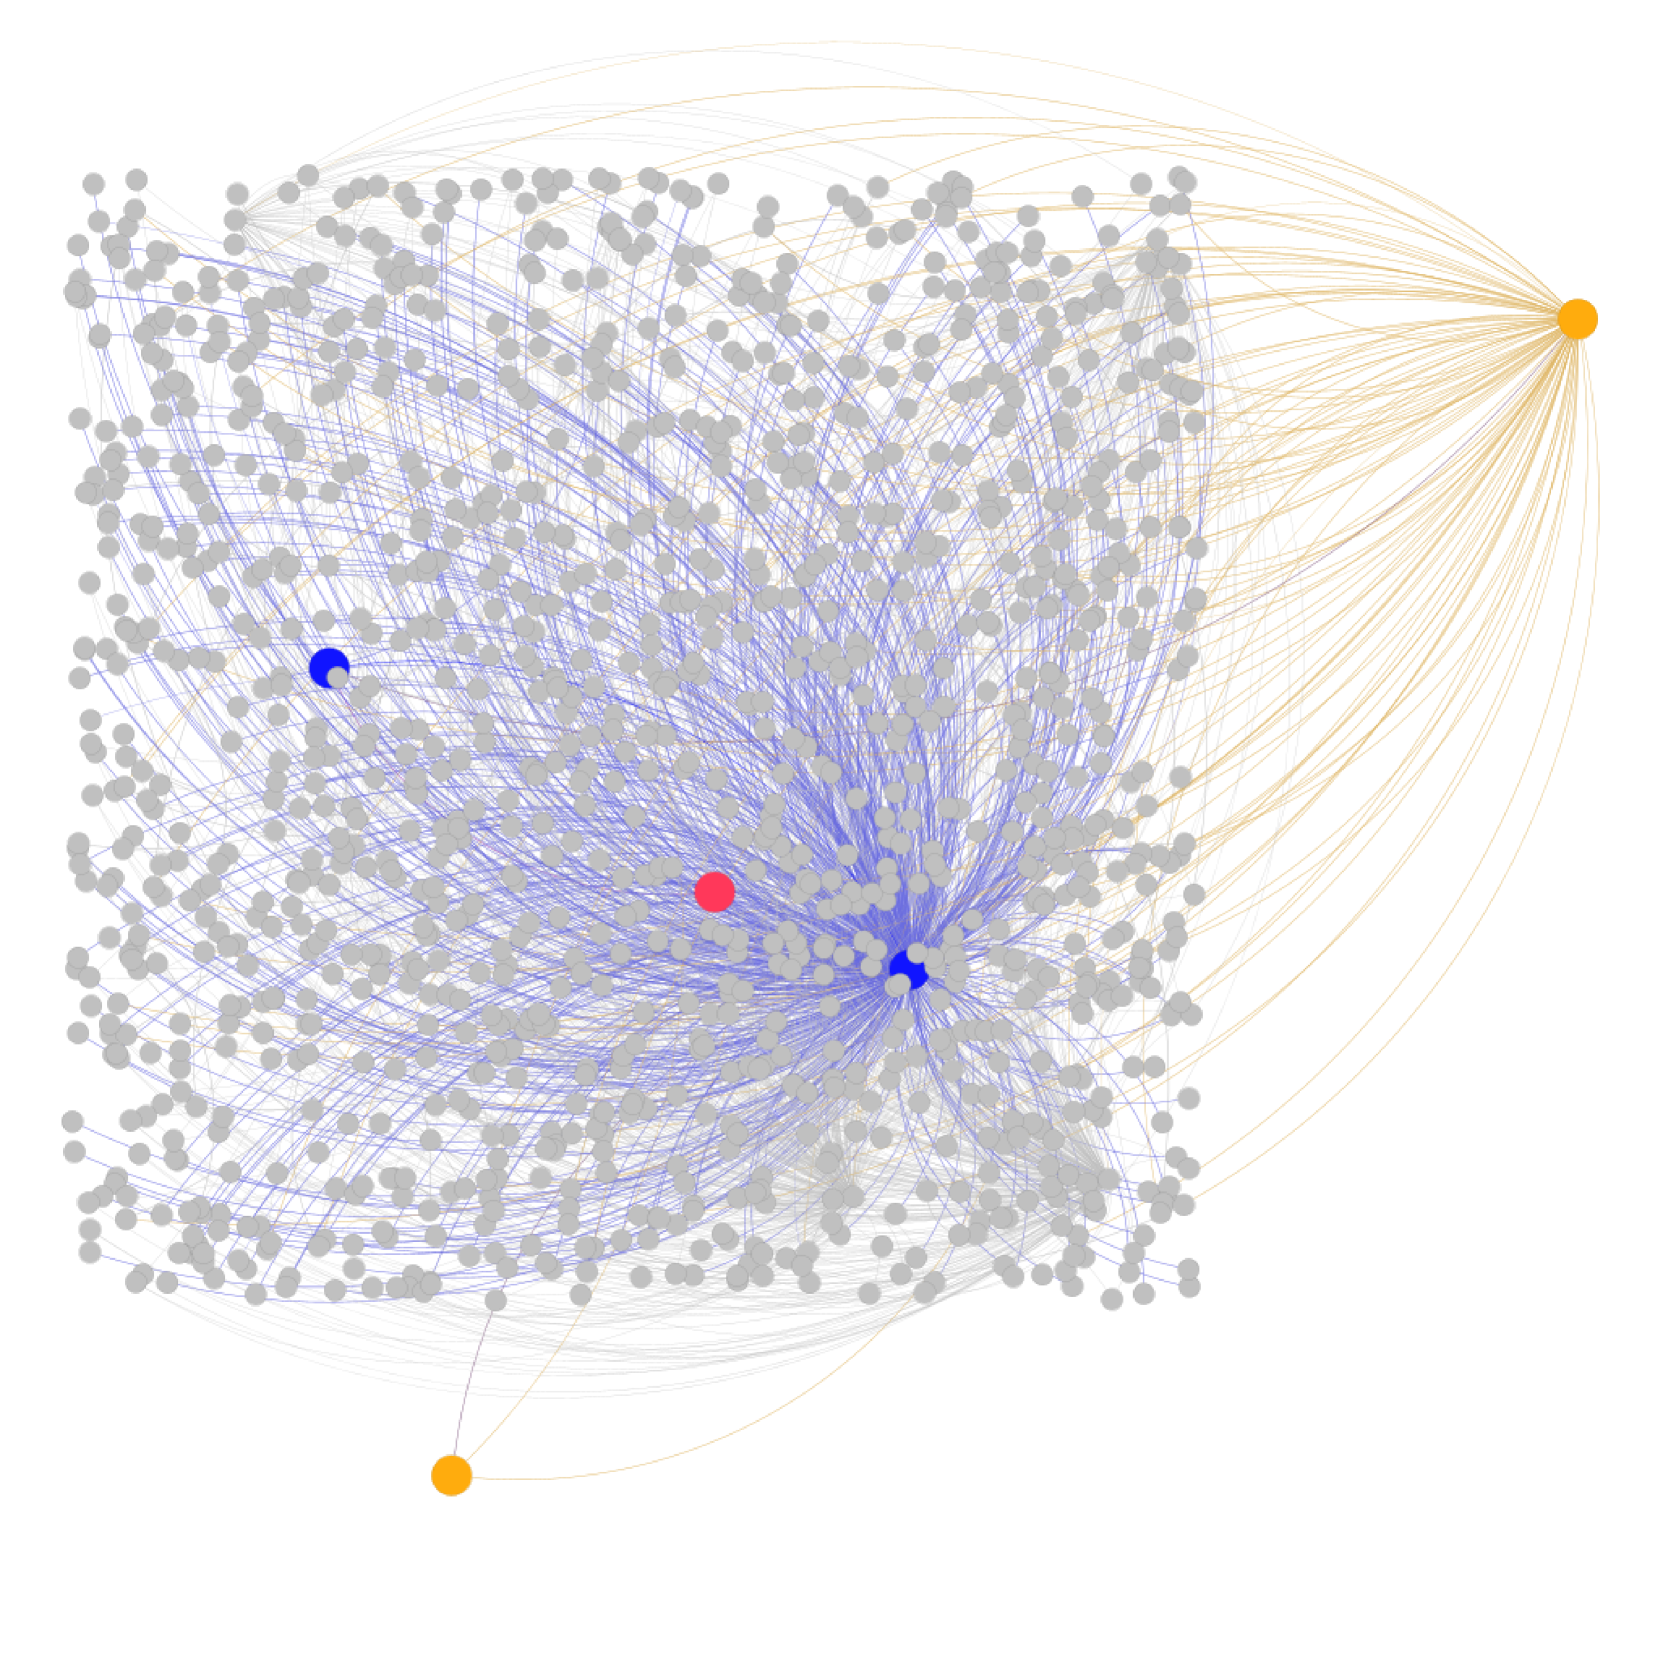
The image displays a complex network graph or diagram on a plain white background. It consists of a large, dense cluster of nodes connected by a web of edges, with a few distinct nodes positioned outside or within this main cluster. There is **no textual information** present in the image—no labels, titles, legends, axis markers, or embedded text. The analysis is therefore based solely on visual structure, color, and spatial relationships.
### Components/Axes
* **Nodes (Vertices):**
* **Gray Nodes:** The vast majority of nodes are small, solid gray circles. They form a dense, roughly circular or amorphous cloud occupying the central and left portions of the image. There are several hundred of these nodes.
* **Colored Nodes:** Four larger, distinctly colored nodes are present:
1. **Blue Node (Left):** Located within the upper-left quadrant of the main gray cluster.
2. **Red Node (Center):** Positioned near the geometric center of the gray cluster.
3. **Blue Node (Right):** Situated within the lower-right quadrant of the gray cluster, appearing as a major connection point.
4. **Orange Node (Top-Right):** Positioned far outside the main cluster, in the upper-right corner of the image.
5. **Orange Node (Bottom-Left):** Positioned outside the main cluster, in the lower-left area of the image.
* **Edges (Connections):**
* **Blue Edges:** A dense network of thin, blue lines primarily connects the gray nodes to each other and to the two blue nodes and the red node within the cluster. The blue edges create a tangled, web-like structure within the main cloud.
* **Orange Edges:** Thinner, orange lines radiate outward from the two orange peripheral nodes. The top-right orange node has a very high degree, with orange edges connecting it to a large number of gray nodes across the entire cluster. The bottom-left orange node has fewer connections, primarily to nodes in the lower part of the cluster. Some orange edges also appear to connect the two orange nodes to each other via the cluster.
### Detailed Analysis
* **Spatial Grounding & Component Isolation:**
* **Header/Top Region:** Dominated by the top-right orange node and the fan of orange edges descending into the main cluster. The upper part of the gray cluster is dense with nodes and blue edges.
* **Main Chart/Center Region:** Contains the core of the network. The red node is centrally located. The right-side blue node acts as a local hub, with a particularly high density of blue edges converging on it. The left-side blue node is more embedded within the cluster.
* **Footer/Bottom Region:** Contains the bottom-left orange node and its connections. The lower edge of the gray cluster is less dense than the center.
* **Trend Verification (Visual Flow):**
* The blue edges show a trend of **high local interconnectivity** within the main cluster, with no clear directional flow. Connections appear dense and somewhat random, suggesting a tightly knit community or system.
* The orange edges show a clear trend of **radial distribution** from the two orange nodes. The top-right node exhibits a "hub-and-spoke" pattern, connecting to many disparate points in the network. This suggests a role of broadcasting, aggregation, or external influence.
### Key Observations
1. **Absence of Text:** The diagram contains zero textual information, making it purely structural.
2. **Two-Tiered Structure:** The network clearly differentiates between a dense, internally connected core (gray nodes with blue edges) and peripheral hub nodes (orange) that connect to the core.
3. **Asymmetric Hubs:** The two orange hub nodes are not equal. The top-right hub is significantly more connected than the bottom-left one.
4. **Internal Hubs:** Within the core cluster, the right-side blue node and the central red node appear to be more central or highly connected than the left-side blue node, based on the density of blue edges around them.
5. **Color Coding:** The use of color (gray, blue, red, orange) is the primary method for distinguishing node types or roles, though their specific meanings are undefined.
### Interpretation
This diagram visually represents a **complex system with a core-periphery structure**. The dense gray cluster with blue connections likely represents a primary, tightly integrated system—such as a social network of friends, a neural network's hidden layers, a database of interlinked records, or a community of interacting species.
The colored nodes within the cluster (blue, red) likely signify **specialized or influential entities** within that core system. The red node's central position might indicate a critical bridge or a unique type of component.
The orange nodes and their edges represent **external agents or interfaces** that interact with the core system. The top-right orange node, with its vast number of connections, strongly suggests a **major external influencer, a data aggregator, a central server, or a primary input/output channel**. Its position outside the cluster implies it is not part of the core community but has a broad reach into it. The bottom-left orange node represents a secondary or more specialized external connection.
The overall structure suggests a system where internal cohesion (blue edges) is high, but it is also subject to significant external influence or connectivity (orange edges) from at least one dominant source. Without labels, the specific domain (e.g., computer network, biological pathway, citation graph) cannot be determined, but the topological pattern is clear and informative.