## Network Graph: Dense Cluster with Peripheral Hubs
### Overview
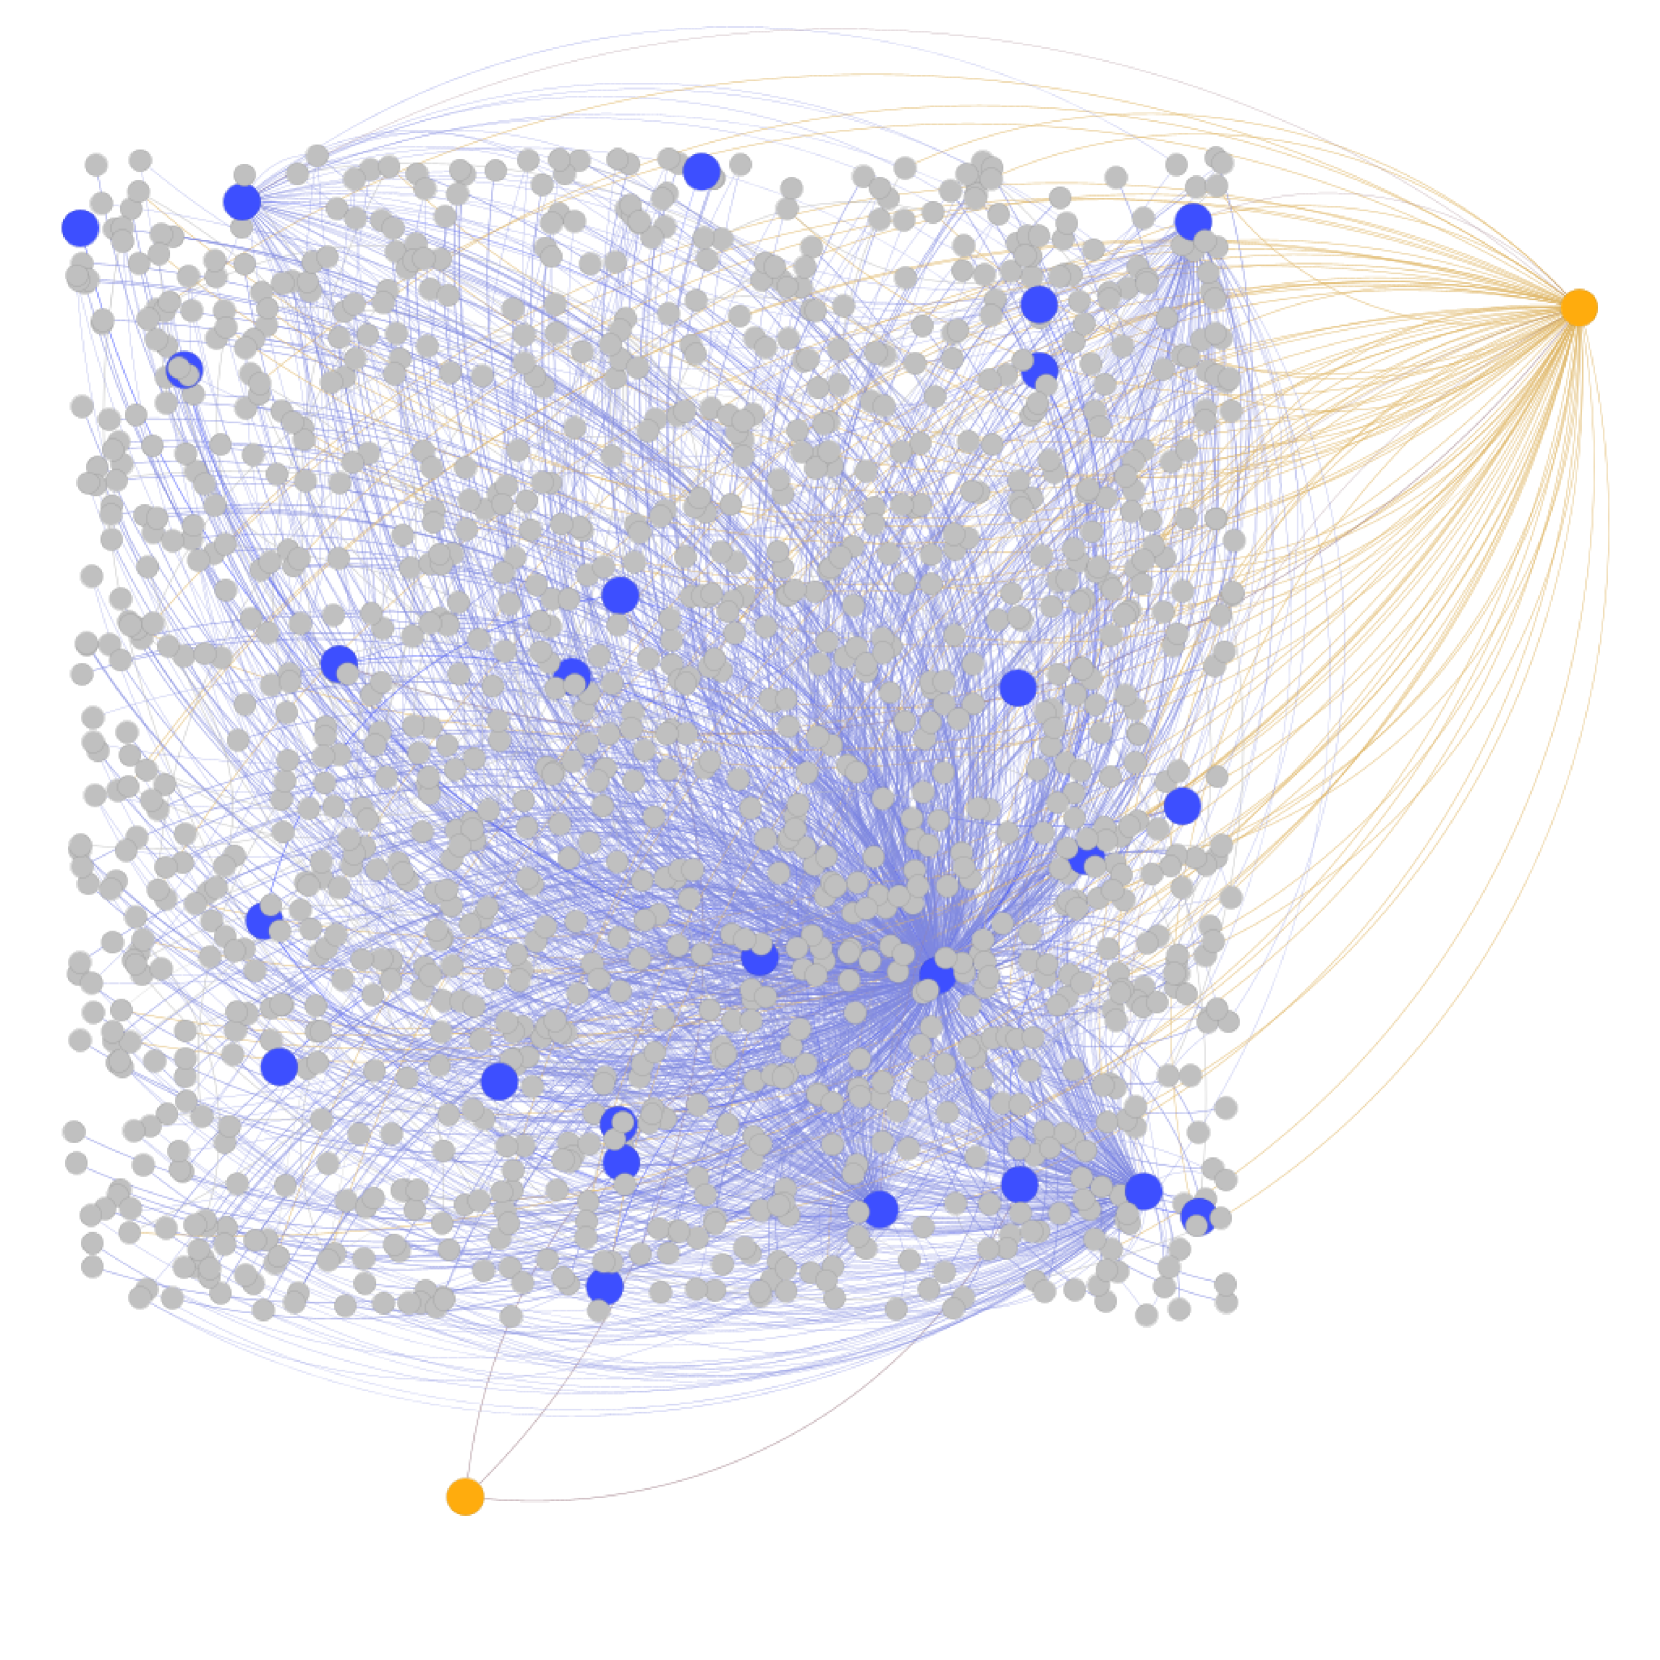
The image displays a complex, force-directed network graph (or node-link diagram) on a plain white background. It visualizes a system of interconnected entities (nodes) and their relationships (edges). The graph is characterized by a very dense central cluster of nodes, with two distinct peripheral nodes acting as major hubs. There is **no textual information** (labels, titles, legends, or annotations) present in the image.
### Components/Axes
* **Nodes (Circles):** Three distinct types are visible, differentiated by color and relative size.
1. **Gray Nodes:** The vast majority of nodes. They are small, uniform in size, and form a dense, roughly circular cloud in the center-left of the image.
2. **Blue Nodes:** Larger than the gray nodes. Approximately 25-30 are scattered throughout the gray cluster, often appearing as local connection points.
3. **Orange Nodes:** Two nodes, significantly larger than all others.
* **Primary Hub (Right):** Positioned on the far right edge of the graph. It is the largest node.
* **Secondary Hub (Bottom):** Positioned at the bottom-center, slightly left. It is smaller than the right hub but larger than the blue nodes.
* **Edges (Lines):** Thin, curved lines connecting nodes. Two colors are present:
1. **Blue Edges:** The most numerous. They form the dense, intricate web connecting nodes within the central cluster (gray-to-gray, gray-to-blue, blue-to-blue).
2. **Orange Edges:** Radiate almost exclusively from the **Primary Hub (Right)**. They connect this hub to a large number of nodes within the central cluster (both gray and blue). A few faint orange lines also connect to the **Secondary Hub (Bottom)**.
### Detailed Analysis
* **Spatial Layout & Density:** The graph uses a force-directed layout where connected nodes attract each other and unconnected ones repel. This results in the dense central cluster where nodes are tightly packed, indicating a high degree of interconnection. The two orange hubs are pushed to the periphery due to their unique connection patterns.
* **Node Distribution:**
* The **gray nodes** are densely packed, with an estimated count in the hundreds (likely 400-600). Their uniform size suggests they may represent standard or equivalent entities in the network.
* The **blue nodes** are distributed semi-randomly within the gray cloud. Their larger size and position as connection points suggest they may be important sub-hubs or nodes of a different class.
* The **Primary Hub (Right Orange Node)** is the most prominent structural element. Its position and the fan of orange edges indicate it is a central point of connection or influence for a significant portion of the network.
* The **Secondary Hub (Bottom Orange Node)** has far fewer connections (approximately 5-10 visible orange edges), suggesting a more specialized or limited role.
* **Connection Patterns:**
* **Intra-Cluster Connections (Blue Edges):** These create a complex, mesh-like topology within the central cluster, implying a highly interconnected community or system where most elements are directly or indirectly linked.
* **Hub-Spoke Connections (Orange Edges):** These create a clear star topology centered on the Primary Hub. This pattern is typical of a client-server model, a central authority, or a major source/sink in a flow network.
### Key Observations
1. **Absence of Text:** The graph contains zero textual labels, making it impossible to identify what the nodes or edges represent without external context.
2. **Two-Tiered Hierarchy:** The network exhibits a clear two-tiered structure: a dense, peer-to-peer-like core (gray/blue nodes with blue edges) and a centralized, hierarchical layer (orange hubs with orange edges).
3. **Asymmetry of Hubs:** The two orange hubs are not equal. The right hub is orders of magnitude more connected than the bottom hub, indicating a significant imbalance in their roles or importance.
4. **Blue Nodes as Bridges:** The blue nodes, while embedded in the gray cluster, often appear to be key connection points for the orange edges from the Primary Hub, potentially acting as bridges or gateways between the core cluster and the central hub.
### Interpretation
This network graph visually represents a system with **both decentralized and centralized characteristics**.
* **The dense gray/blue cluster** suggests a robust, resilient community or network where information, resources, or influence can flow through many alternative paths. This could model a social network, a research collaboration field, a biological protein interaction network, or a peer-to-peer communication system.
* **The dominant Primary Hub (Right)** introduces a point of centralization, control, or aggregation. This could represent a major platform, a central server, a key influencer, a funding agency, or a critical resource that many entities in the core depend on. Its high connectivity makes it a potential single point of failure or a powerful coordinator.
* **The Secondary Hub (Bottom)** may represent a niche authority, a backup system, or a specialized service with a more limited, dedicated user base within the larger network.
**The overall structure implies a "network of networks" or a hybrid system.** The core operates with distributed dynamics, but its overall behavior and connectivity are significantly shaped by its relationship with a powerful external hub. The lack of labels prevents specific domain interpretation, but the topological patterns are classic in studies of social networks, the internet, biological systems, and organizational charts. The graph effectively communicates concepts of density, centrality, hierarchy, and the interplay between distributed and centralized control.