## Comparative Image Grid: Training Progress with and without Scale Constraint
### Overview
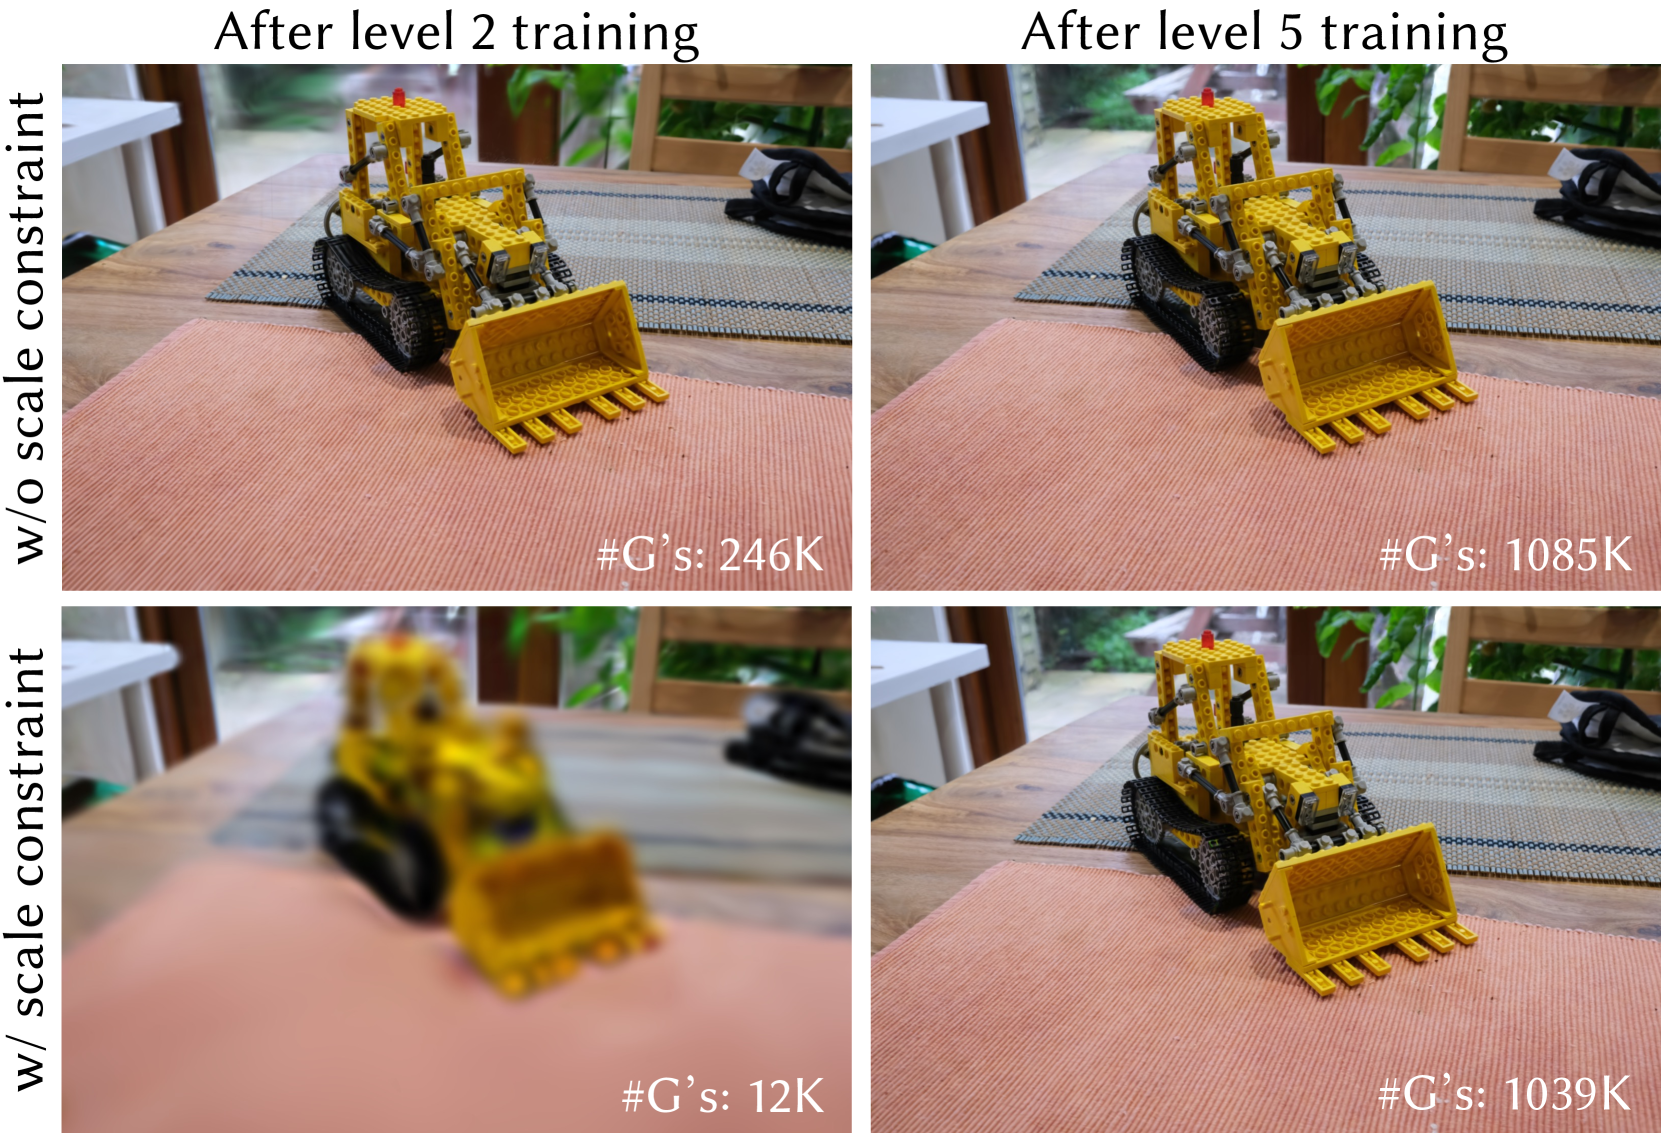
The image is a 2x2 comparative grid of four photographs. Each photograph shows the same subject: a yellow LEGO Technic bulldozer model placed on a wooden table with placemats. The grid compares the visual results of a training process under two different conditions ("w/o scale constraint" and "w/ scale constraint") at two different training stages ("After level 2 training" and "After level 5 training"). A numerical metric labeled "#G's:" is provided in the bottom-right corner of each individual photo.
### Components/Axes
The image is organized as a matrix with the following labels and structure:
* **Row Labels (Vertical, Left Side):**
* Top Row: `w/o scale constraint`
* Bottom Row: `w/ scale constraint`
* **Column Labels (Horizontal, Top):**
* Left Column: `After level 2 training`
* Right Column: `After level 5 training`
* **Data Metric (Embedded in each photo, bottom-right):**
* Label: `#G's:` (Likely an abbreviation for "Gradients" or a similar training iteration/step count).
* Values: `246K`, `1085K`, `12K`, `1039K`.
### Detailed Analysis
The grid presents four distinct states:
1. **Top-Left (w/o scale constraint, After level 2 training):**
* **Visual:** The LEGO bulldozer is in sharp focus. Details like individual studs, the tread pattern, and the bucket teeth are clearly visible. The background (window, plants) is also reasonably clear.
* **Data:** `#G's: 246K`
2. **Top-Right (w/o scale constraint, After level 5 training):**
* **Visual:** The image remains sharp and clear, visually identical in quality to the top-left image. The bulldozer and background are well-defined.
* **Data:** `#G's: 1085K`
3. **Bottom-Left (w/ scale constraint, After level 2 training):**
* **Visual:** The image is severely blurred. The bulldozer is recognizable only by its general shape and color. No fine details are discernible. The background is a soft, indistinct blur.
* **Data:** `#G's: 12K`
4. **Bottom-Right (w/ scale constraint, After level 5 training):**
* **Visual:** The image has recovered to a sharp, clear state, comparable in quality to the two images in the top row. All details of the model and setting are visible again.
* **Data:** `#G's: 1039K`
### Key Observations
* **Clarity vs. Constraint:** The presence of the "scale constraint" has a dramatic negative impact on visual clarity at the earlier training stage (level 2), resulting in a completely blurred image. This constraint does not appear to affect the final clarity at level 5.
* **Training Progression:** For both conditions, the `#G's` metric increases significantly from level 2 to level 5 (246K → 1085K without constraint; 12K → 1039K with constraint), indicating more training steps or computations were performed.
* **Metric Discrepancy at Level 2:** There is a massive difference in the `#G's` count at level 2 between the two conditions (246K vs. 12K). The constrained process has performed far fewer gradient updates at this stage.
* **Convergence at Level 5:** By level 5, the `#G's` counts for both conditions are much closer in magnitude (1085K vs. 1039K), and the visual results are similarly high-quality.
### Interpretation
This image likely illustrates a concept from machine learning or optimization, specifically the effect of a "scale constraint" (which could relate to learning rate, gradient scaling, or parameter normalization) on the training dynamics of a model, possibly a generative model tasked with reconstructing or rendering this image.
* **What the data suggests:** The scale constraint appears to severely hinder or slow down the initial phase of training (level 2), as evidenced by both the extremely low `#G's` count and the resulting poor-quality, blurred output. It acts as a significant bottleneck early on.
* **How elements relate:** The comparison shows that this early bottleneck is not permanent. Given sufficient training (to level 5), the constrained process "catches up," achieving a high `#G's` count and producing a final result that is visually indistinguishable from the unconstrained process. The unconstrained process, meanwhile, proceeds smoothly from the start.
* **Notable patterns/anomalies:** The most striking anomaly is the 20x difference in `#G's` at level 2 (246K vs. 12K). This suggests the constraint might cause the optimization to take many fewer, or much smaller, steps initially. The fact that both converge to a similar high-quality result by level 5 implies the constraint may enforce a more cautious or regularized optimization path that is slower to start but ultimately effective. The image serves as a visual proof that the constraint's primary effect is on training efficiency and trajectory, not necessarily on the final achievable quality.