## Line Graphs: Age-Dependent D̂α(C) Across Countries and Trends
### Overview
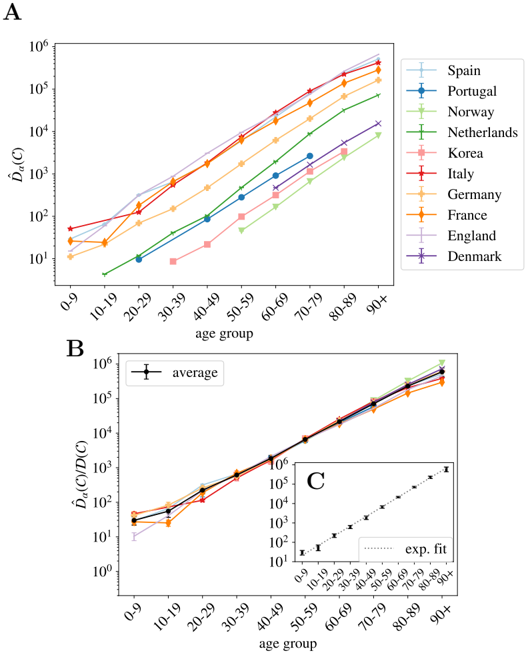
The image contains three interconnected line graphs (A, B, C) analyzing age-dependent values of D̂α(C) across different countries and age groups. Chart A shows country-specific trends, Chart B presents an average trend, and Chart C provides an exponential fit for a subset of data.
### Components/Axes
**Chart A (Main Panel):**
- **Y-axis (left):** D̂α(C) (log scale: 10¹ to 10⁶)
- **X-axis:** Age groups (0-9, 10-19, ..., 90+)
- **Legend (top-right):**
- Spain (light blue), Portugal (dark blue), Norway (green), Netherlands (dark green), Korea (pink), Italy (red), Germany (orange), France (yellow), England (purple), Denmark (dark purple)
- **Inset Chart C (bottom-right of Chart B):**
- Y-axis: D̂α(C) (log scale: 10¹ to 10⁶)
- X-axis: Age groups (0-9 to 90+)
- Dotted line labeled "exp. fit"
**Chart B (Average Trend):**
- **Y-axis (left):** D̂α(C)/D(C) (log scale: 10⁰ to 10⁶)
- **X-axis:** Age groups (0-9 to 90+)
- **Legend:** "average" (black line with error bars)
### Detailed Analysis
**Chart A Trends:**
- All countries show **upward trends** with age, but slopes vary:
- **Italy (red)** and **France (yellow)** have the steepest increases, reaching ~10⁵ by 90+.
- **Norway (green)** and **Netherlands (dark green)** show moderate growth (~10³ to 10⁴).
- **Korea (pink)** and **Denmark (dark purple)** exhibit slower growth (~10² to 10³).
- **Spain (light blue)** and **Portugal (dark blue)** start low but accelerate sharply after 60-69.
- **Germany (orange)** and **England (purple)** follow intermediate trajectories.
**Chart B (Average):**
- The **black "average" line** rises exponentially, doubling roughly every 10-year age group (e.g., ~10¹ at 0-9 to ~10⁶ at 90+).
- Error bars (vertical lines) indicate uncertainty, smallest for younger age groups and largest for 90+.
**Chart C (Exponential Fit):**
- Data points align closely with the **dotted exponential curve**, confirming a power-law relationship: D̂α(C) ∝ exp(k·age).
### Key Observations
1. **Country-Specific Variability:** Italy and France show significantly higher D̂α(C) values across all age groups compared to other nations.
2. **Exponential Scaling:** Both the average trend (Chart B) and inset fit (Chart C) confirm exponential growth with age.
3. **Data Uncertainty:** Larger error bars in older age groups (e.g., 90+) suggest less reliable measurements or higher variability.
### Interpretation
The data suggests that D̂α(C) scales exponentially with age across populations, with country-specific factors (e.g., healthcare systems, lifestyle) influencing the magnitude. Italy and France’s elevated values may reflect demographic or epidemiological differences. The exponential fit in Chart C implies a universal mechanistic relationship, potentially tied to biological aging processes. Discrepancies between countries highlight the need for region-specific public health strategies.