\n
## Diagram: Visual Spatial Cues Processing Pipeline
### Overview
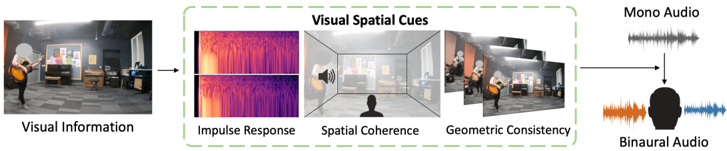
The image depicts a diagram illustrating a pipeline for converting visual information into binaural audio. It shows how visual cues are extracted from a scene and used to generate spatial audio. The process involves stages like impulse response estimation, spatial coherence analysis, and geometric consistency checks before ultimately producing binaural audio for a listener.
### Components/Axes
The diagram is structured as a flow chart with the following components:
* **Visual Information:** An image of a person playing a guitar in a room.
* **Visual Spatial Cues:** A green-bordered box containing four sub-components:
* **Impulse Response:** Represented by a heatmap-like image with purple and yellow hues.
* **Spatial Coherence:** A 3D rendering of a room with a speaker icon in the center.
* **Geometric Consistency:** Multiple images of the same scene from slightly different perspectives.
* **Mono Audio:** A waveform representation of monaural audio.
* **Binaural Audio:** A waveform representation of binaural audio, split into orange and blue channels, directed towards a head silhouette.
### Detailed Analysis or Content Details
The diagram illustrates a sequential process:
1. **Visual Information Input:** The process begins with visual information captured as an image of a person playing a guitar in a room.
2. **Visual Spatial Cues Extraction:** This visual information is then processed to extract visual spatial cues.
* **Impulse Response:** The impulse response is visualized as a heatmap. The colors range from deep purple to bright yellow, suggesting varying levels of intensity or magnitude.
* **Spatial Coherence:** A 3D room rendering with a speaker indicates the analysis of spatial coherence. The speaker is positioned centrally within the room.
* **Geometric Consistency:** Multiple views of the scene are used to ensure geometric consistency. The images show the same scene from slightly different angles.
3. **Audio Conversion:** The extracted visual spatial cues are used to convert mono audio into binaural audio.
4. **Binaural Audio Output:** The final output is binaural audio, represented by two waveforms (orange and blue) directed towards a head silhouette, indicating left and right ear channels.
### Key Observations
The diagram highlights the importance of visual information in generating realistic spatial audio. The use of multiple visual cues (impulse response, spatial coherence, geometric consistency) suggests a robust approach to spatial audio rendering. The conversion from mono to binaural audio indicates the goal of creating a more immersive listening experience.
### Interpretation
This diagram demonstrates a method for creating spatial audio from visual data. The pipeline suggests that by analyzing the visual environment, it's possible to estimate the acoustic properties of the space and generate audio that accurately reflects the perceived location of sound sources. The inclusion of impulse response, spatial coherence, and geometric consistency suggests a sophisticated approach that aims to overcome the limitations of traditional mono audio. The final output of binaural audio, directed towards a head, implies the intention to create a personalized and immersive audio experience for the listener. The diagram is a conceptual illustration of a system, and does not provide specific numerical data or performance metrics. It focuses on the *process* rather than the *results*.