## Line Chart: Pass@k (%) Performance Across Different Models
### Overview
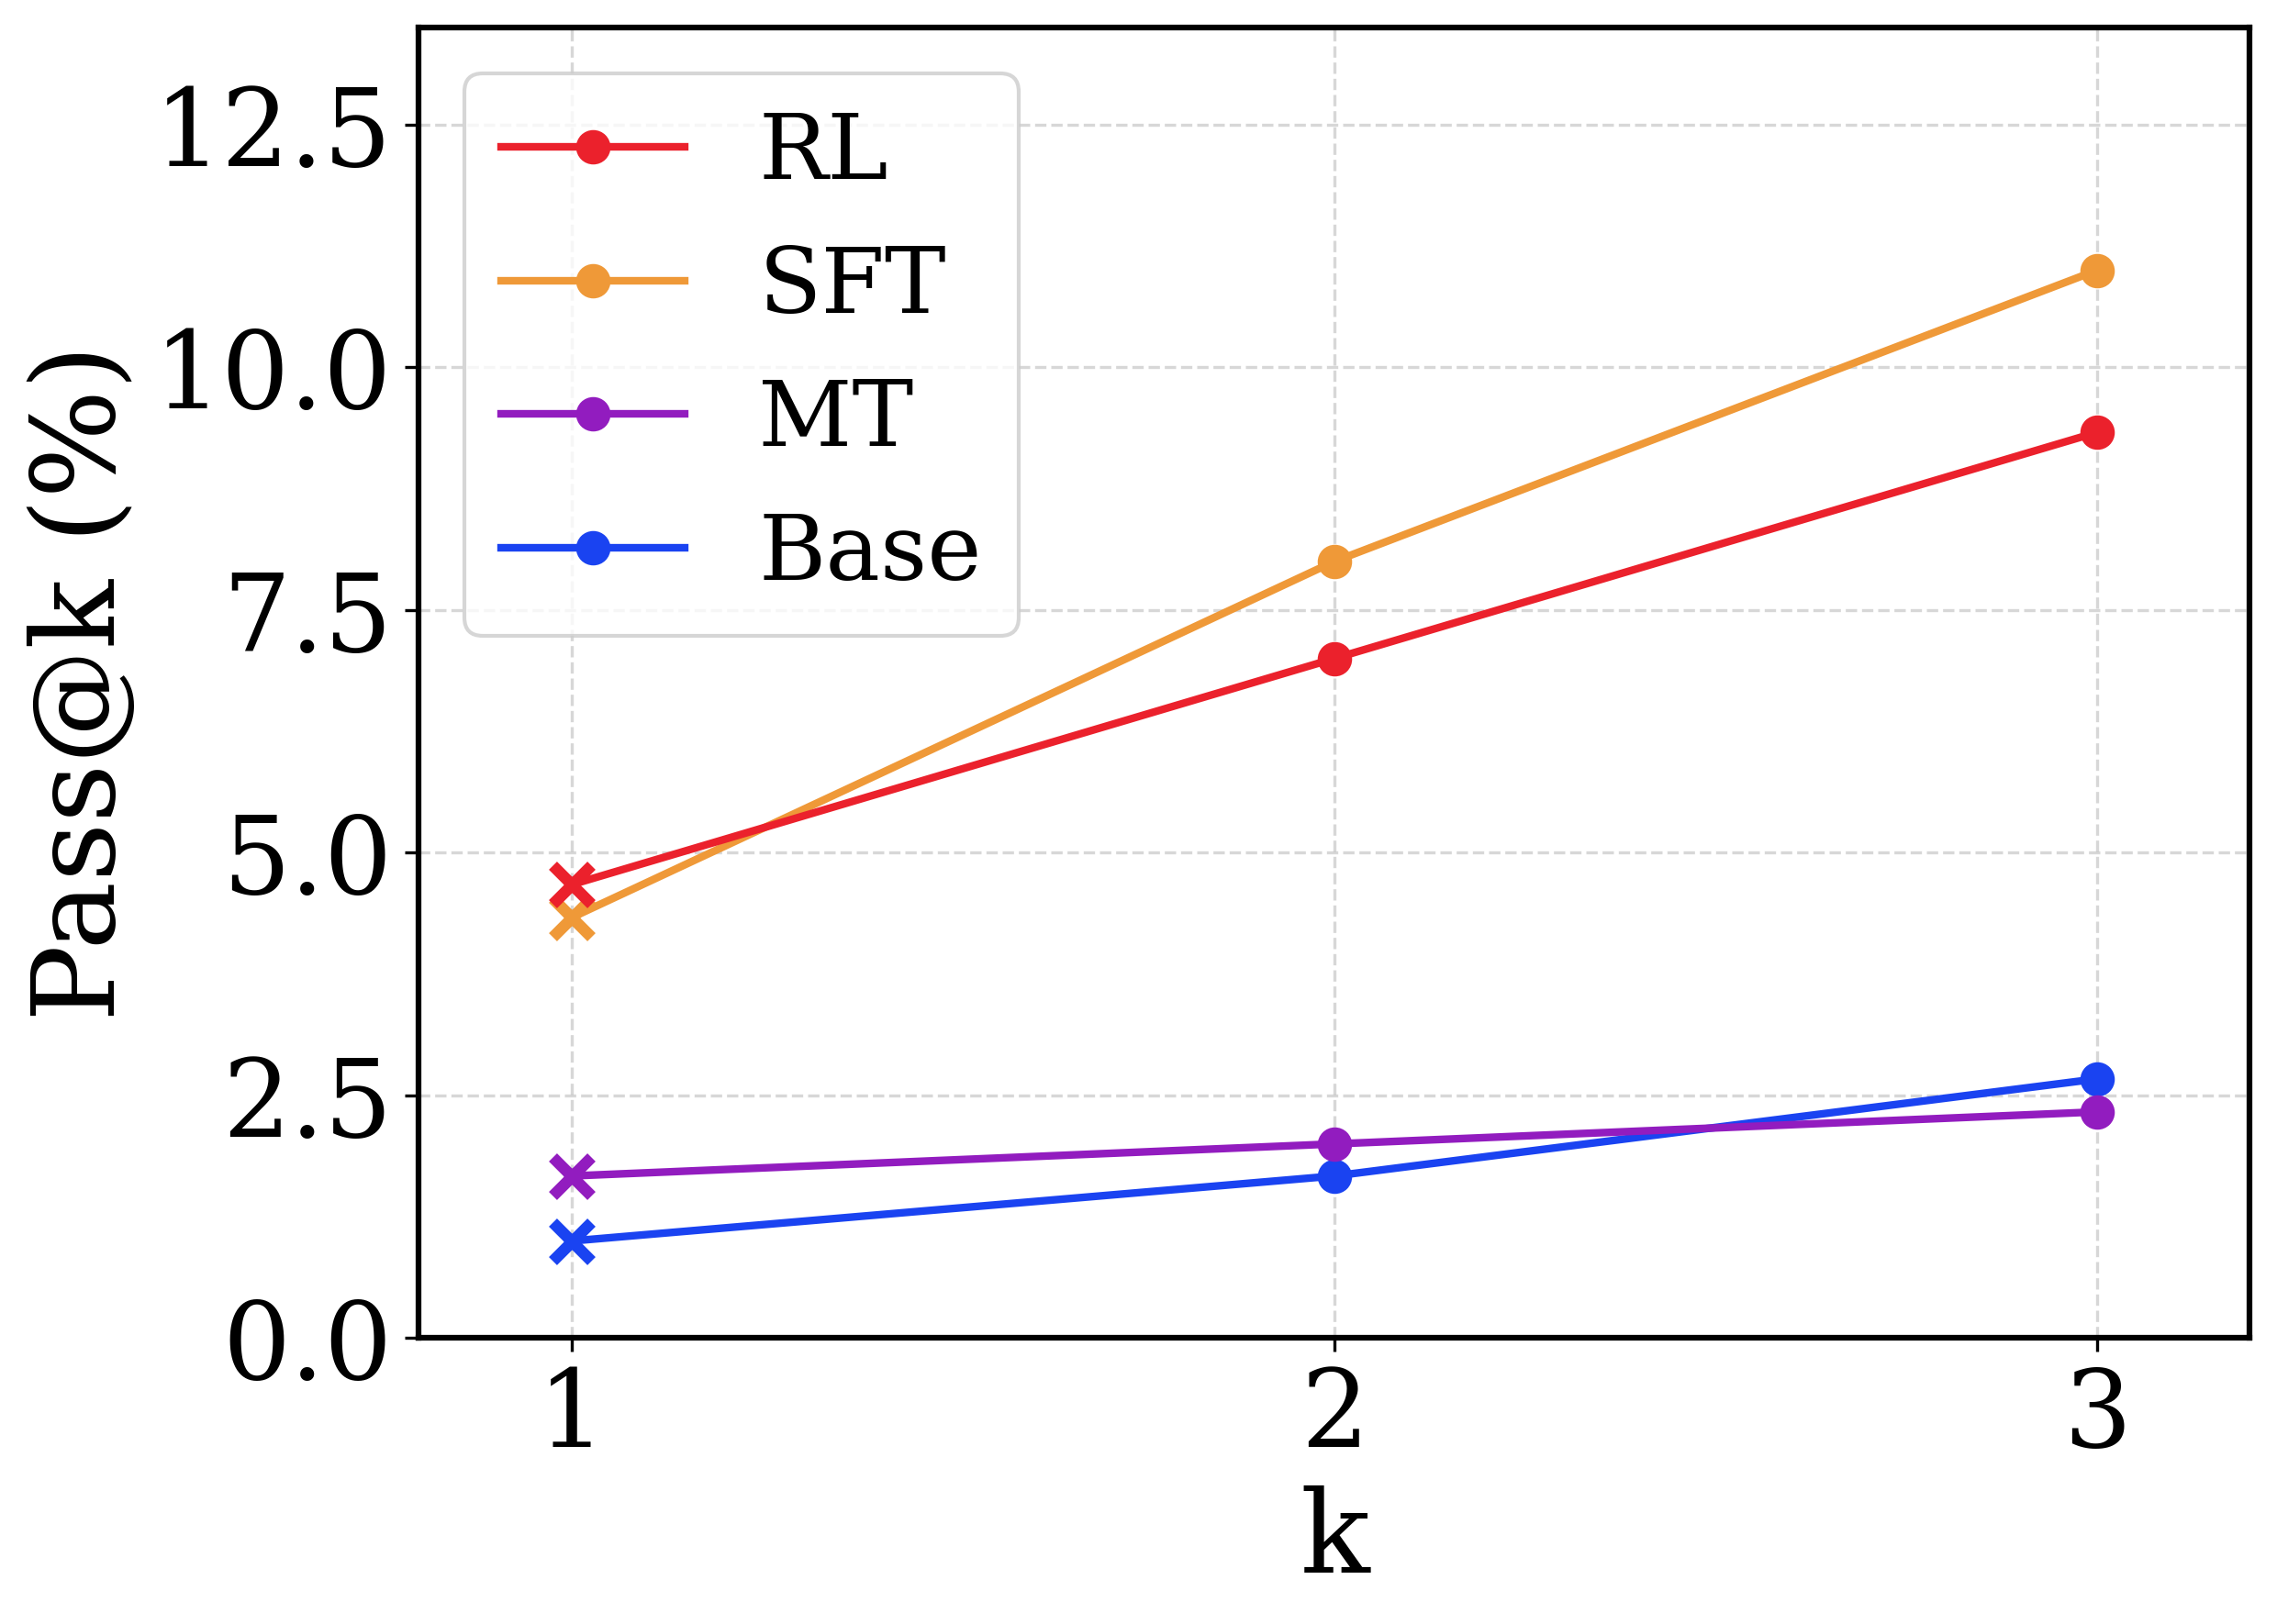
This image is a line chart comparing the performance of four different models or methodologies—labeled as RL, SFT, MT, and Base—measured by the "Pass@k (%)" metric across three discrete values of "k" (1, 2, and 3). The chart demonstrates how performance scales as the number of allowed attempts/samples (k) increases.
*Language Declaration:* The text in the image is entirely in English.
### Components/Axes
**1. Y-Axis (Vertical, Left):**
* **Label:** `Pass@k (%)` (Oriented vertically, reading bottom to top).
* **Scale:** Linear, ranging from 0.0 to 12.5.
* **Markers/Ticks:** Major ticks are placed at intervals of 2.5 (0.0, 2.5, 5.0, 7.5, 10.0, 12.5).
* **Gridlines:** Light grey, dashed horizontal lines extend from each major tick mark across the chart area.
**2. X-Axis (Horizontal, Bottom):**
* **Label:** `k` (Centered below the axis).
* **Scale:** Discrete integer values.
* **Markers/Ticks:** Ticks are placed at 1, 2, and 3.
* **Gridlines:** Light grey, dashed vertical lines extend upward from each tick mark.
**3. Legend:**
* **Positioning:** Located in the top-left corner of the chart area, enclosed in a rounded rectangular box with a light grey border.
* **Entries (Color and Label):**
* Red line with a solid circle: `RL`
* Orange line with a solid circle: `SFT`
* Purple line with a solid circle: `MT`
* Blue line with a solid circle: `Base`
*Note on Markers:* While the legend displays solid circles for all entries, the actual data points plotted at `k=1` use an 'x' (cross) marker, whereas points at `k=2` and `k=3` use solid circle markers.
### Detailed Analysis
Below is the extraction of data points based on visual estimation against the gridlines.
**1. SFT (Orange Line)**
* **Visual Trend:** Slopes upward significantly. It starts slightly below the RL line at k=1, crosses above it before k=2, and exhibits the steepest positive trajectory, ending as the highest value at k=3.
* **Data Points:**
* `k=1`: ~4.4% (Marker: 'x')
* `k=2`: ~8.0% (Marker: solid circle, slightly above the 7.5 gridline)
* `k=3`: ~11.0% (Marker: solid circle, below the 12.5 gridline)
**2. RL (Red Line)**
* **Visual Trend:** Slopes upward steadily. It starts as the highest value at k=1 but is overtaken by SFT, finishing second highest at k=3.
* **Data Points:**
* `k=1`: ~4.7% (Marker: 'x', slightly below the 5.0 gridline)
* `k=2`: ~7.0% (Marker: solid circle, below the 7.5 gridline)
* `k=3`: ~9.4% (Marker: solid circle, below the 10.0 gridline)
**3. Base (Blue Line)**
* **Visual Trend:** Slopes upward gently. It starts as the lowest performing model at k=1, but its slope is steeper than MT, allowing it to cross above MT just before k=3.
* **Data Points:**
* `k=1`: ~1.0% (Marker: 'x')
* `k=2`: ~1.7% (Marker: solid circle)
* `k=3`: ~2.7% (Marker: solid circle, slightly above the 2.5 gridline)
**4. MT (Purple Line)**
* **Visual Trend:** Nearly flat with a very slight upward slope. It starts above the Base model but exhibits the least improvement as k increases, ending as the lowest value at k=3.
* **Data Points:**
* `k=1`: ~1.7% (Marker: 'x')
* `k=2`: ~2.0% (Marker: solid circle)
* `k=3`: ~2.3% (Marker: solid circle, slightly below the 2.5 gridline)
### Key Observations
* **Bifurcation of Performance:** There is a massive performance gap dividing the models into two distinct tiers. RL and SFT are high-performing (ranging from ~4% to 11%), while MT and Base are low-performing (ranging from ~1% to ~3%).
* **Crossover Events:**
* **SFT vs. RL:** RL is superior at `k=1`, but SFT scales much better with multiple attempts, overtaking RL at `k=2` and widening the gap at `k=3`.
* **Base vs. MT:** MT is superior at `k=1` and `k=2`, but Base scales slightly better, overtaking MT at `k=3`.
* **Universal Improvement:** All models show absolute improvement as `k` increases, which is a mathematical certainty for the Pass@k metric (more attempts equal a higher or equal chance of passing), but the *rate* of improvement varies drastically.
### Interpretation
The chart likely represents the evaluation of Large Language Models (LLMs) on a generative task, such as code generation or mathematical reasoning, where "Pass@k" measures the probability that at least one out of *k* generated samples is correct.
* **Methodology Impact:** The data clearly demonstrates that advanced training techniques (RL - Reinforcement Learning, and SFT - Supervised Fine-Tuning) drastically outperform the "Base" model and "MT" (likely Multi-Task or Machine Translation, depending on context).
* **Diversity vs. Accuracy (SFT vs RL):** The crossover between RL and SFT is the most critical insight. RL models are often optimized to produce the single best answer (greedy decoding), which explains why RL wins at `k=1` (highest top-1 accuracy). However, SFT models often retain a higher diversity of outputs. When allowed multiple attempts (`k=2`, `k=3`), the SFT model's diverse generations are more likely to stumble upon the correct answer than the RL model, which might repeatedly generate similar, slightly flawed outputs.
* **Marker Anomaly:** The use of 'x' markers exclusively at `k=1` might denote a difference in how the metric is calculated or sampled at the first attempt (e.g., greedy decoding for k=1 vs. temperature sampling for k>1), though this is speculative without the accompanying paper text.