TECHNICAL ASSET FINGERPRINT
d1cc100a620e9f8cc85abcc4
Click to view fullscreen
Press ESC or click to close
FOUND IN PAPERS
EXPERT: gemini-2.0-flash VERSION 1
RUNTIME: nugit/gemini/gemini-2.0-flash
INTEL_VERIFIED
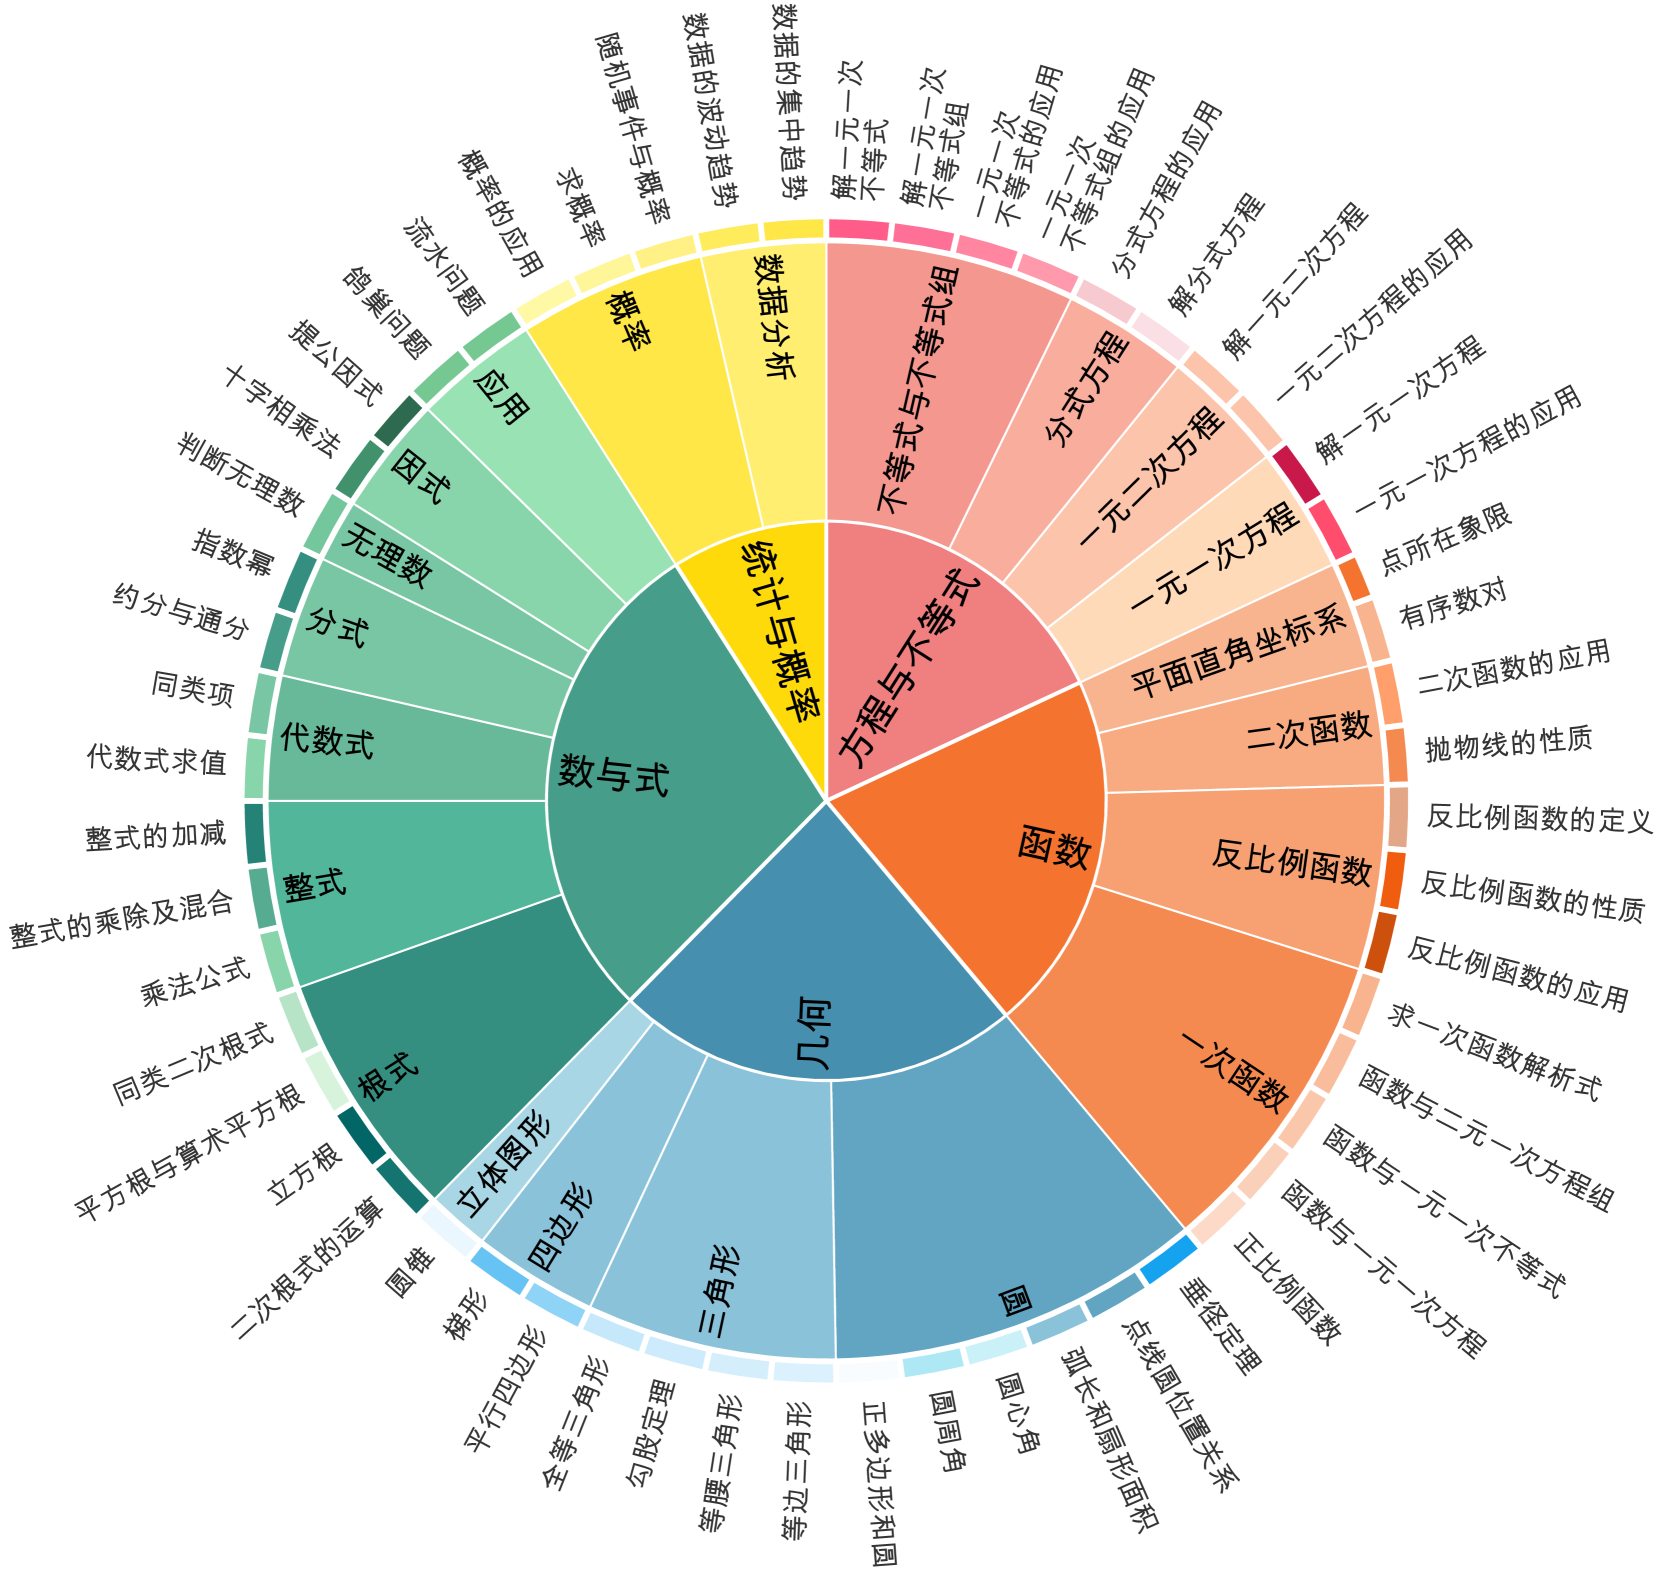
## Circular Chart: Mathematics Topics
### Overview
The image is a circular chart, resembling a pie chart, that visually organizes various mathematical topics. The chart is divided into several main categories, each represented by a different color and further subdivided into more specific sub-topics. All text is in Chinese, with English translations provided.
### Components/Axes
The chart is structured in concentric rings, with the main categories in the inner ring and sub-categories in the outer rings. The main categories are:
* **数与式 (Shù yǔ shì)** - Numbers and Expressions (Green)
* **统计与概率 (Tǒngjì yǔ gàilǜ)** - Statistics and Probability (Yellow)
* **方程与不等式 (Fāngchéng yǔ bù děngshì)** - Equations and Inequalities (Pink)
* **函数 (Hánshù)** - Functions (Orange)
* **几何 (Jǐhé)** - Geometry (Blue)
### Detailed Analysis or ### Content Details
Here's a breakdown of the sub-categories within each main category:
**1. 数与式 (Shù yǔ shì) - Numbers and Expressions (Green)**
* **代数式 (Dàishùshì)** - Algebraic Expressions
* 代数式求值 (Dàishùshì qiúzhí) - Evaluating Algebraic Expressions
* 同类项 (Tónglèi xiàng) - Like Terms
* **分式 (Fēnshì)** - Fractions
* 约分与通分 (Yuē fēn yǔ tōng fēn) - Reducing and Finding Common Denominators
* **无理数 (Wúlǐshù)** - Irrational Numbers
* 指数幂 (Zhǐshù mì) - Exponential Powers
* 判断无理数 (Pànduàn wúlǐshù) - Judging Irrational Numbers
* **因式 (Yīnsì)** - Factors
* 十字相乘法 (Shízì xiāng chéng fǎ) - Cross Multiplication Method
* **整式 (Zhěngshì)** - Polynomials
* 整式的加减 (Zhěngshì de jiājiǎn) - Addition and Subtraction of Polynomials
* 整式的乘除及混合 (Zhěngshì de chéng chú jí hùnhé) - Multiplication, Division, and Mixture of Polynomials
* **根式 (Gēnshì)** - Radicals
* 乘法公式 (Chéngfǎ gōngshì) - Multiplication Formulas
* 同类二次根式 (Tónglèi èrcì gēnshì) - Like Quadratic Radicals
* 平方根与算术平方根 (Píngfāng gēn yǔ suànshù píngfāng gēn) - Square Roots and Arithmetic Square Roots
* 二次根式的运算 (Èrcì gēnshì de yùsuàn) - Operations with Quadratic Radicals
* **立方根 (Lìfāng gēn)** - Cube Roots
**2. 统计与概率 (Tǒngjì yǔ gàilǜ) - Statistics and Probability (Yellow)**
* **概率 (Gàilǜ)** - Probability
* 求概率 (Qiú gàilǜ) - Finding Probability
* 概率的应用 (Gàilǜ de yìngyòng) - Application of Probability
* 随机事件与概率 (Suíjī shìjiàn yǔ gàilǜ) - Random Events and Probability
* 数据的波动趋势 (Shùjù de bōdòng qūshì) - Trend of Data Fluctuation
* 数据的集中趋势 (Shùjù de jízhōng qūshì) - Trend of Data Concentration
* **应用 (Yìngyòng)** - Application
* 流水问题 (Liúshuǐ wèntí) - Current Problems
* 鸽巢问题 (Gē cháo wèntí) - Pigeonhole Principle
* **数据分析 (Shùjù fēnxī)** - Data Analysis
* 提公因式 (Tí gōng yīnsì) - Factoring out the Greatest Common Factor
**3. 方程与不等式 (Fāngchéng yǔ bù děngshì) - Equations and Inequalities (Pink)**
* **不等式与不等式组 (Bù děngshì yǔ bù děngshì zǔ)** - Inequalities and Systems of Inequalities
* 解一元一次不等式 (Jiě yīyuán yīcì bù děngshì) - Solving Linear Inequalities in One Variable
* 一元一次不等式组 (Yīyuán yīcì bù děngshì zǔ) - Systems of Linear Inequalities in One Variable
* 一元一次不等式的应用 (Yīyuán yīcì bù děngshì de yìngyòng) - Applications of Linear Inequalities in One Variable
* **分式方程 (Fēnshì fāngchéng)** - Fractional Equations
* 分式方程的应用 (Fēnshì fāngchéng de yìngyòng) - Applications of Fractional Equations
* 解分式方程 (Jiě fēnshì fāngchéng) - Solving Fractional Equations
* **一元二次方程 (Yīyuán èrcì fāngchéng)** - Quadratic Equations in One Variable
* 一元二次方程的应用 (Yīyuán èrcì fāngchéng de yìngyòng) - Applications of Quadratic Equations in One Variable
* 解一元二次方程 (Jiě yīyuán èrcì fāngchéng) - Solving Quadratic Equations in One Variable
**4. 函数 (Hánshù) - Functions (Orange)**
* **一次函数 (Yīcì hánshù)** - Linear Functions
* 函数与一元一次不等式 (Hánshù yǔ yīyuán yīcì bù děngshì) - Functions and Linear Inequalities in One Variable
* 函数与一元一次方程 (Hánshù yǔ yīyuán yīcì fāngchéng) - Functions and Linear Equations in One Variable
* 函数与二元一次方程组 (Hánshù yǔ èryuán yīcì fāngchéng zǔ) - Functions and Systems of Linear Equations in Two Variables
* 求一次函数解析式 (Qiú yīcì hánshù jiěxīshì) - Finding the Analytical Expression of a Linear Function
* **反比例函数 (Fǎn bǐlì hánshù)** - Inverse Proportionality Functions
* 反比例函数的应用 (Fǎn bǐlì hánshù de yìngyòng) - Applications of Inverse Proportionality Functions
* 反比例函数的性质 (Fǎn bǐlì hánshù de xìngzhì) - Properties of Inverse Proportionality Functions
* 反比例函数的定义 (Fǎn bǐlì hánshù de dìngyì) - Definition of Inverse Proportionality Functions
* **二次函数 (Èrcì hánshù)** - Quadratic Functions
* 抛物线的性质 (Pāowùxiàn de xìngzhì) - Properties of Parabolas
* 二次函数的应用 (Èrcì hánshù de yìngyòng) - Applications of Quadratic Functions
* **平面直角坐标系 (Píngmiàn zhíjiǎo zuòbiāo xì)** - Cartesian Coordinate System
* 有序数对 (Yǒuxù shù duì) - Ordered Pairs
* 点所在象限 (Diǎn suǒzài xiàngxiàn) - Quadrant Where a Point is Located
**5. 几何 (Jǐhé) - Geometry (Blue)**
* **圆 (Yuán)** - Circle
* 圆心角 (Yuánxīn jiǎo) - Central Angle
* 圆周角 (Yuánzhōu jiǎo) - Inscribed Angle
* 正多边形和圆 (Zhèng duōbiānxíng hé yuán) - Regular Polygons and Circles
* 弧长和扇形面积 (Hú cháng hé shànxíng miànjī) - Arc Length and Sector Area
* 点线圆位置关系 (Diǎn xiàn yuán wèizhì guānxì) - Positional Relationship between Points, Lines, and Circles
* 垂径定理 (Chuí jìng dìnglǐ) - Perpendicular Bisector Theorem
* **三角形 (Sānjiǎoxíng)** - Triangle
* 等边三角形 (Děngbiān sānjiǎoxíng) - Equilateral Triangle
* 等腰三角形 (Děngyāo sānjiǎoxíng) - Isosceles Triangle
* 勾股定理 (Gōugǔ dìnglǐ) - Pythagorean Theorem
* 全等三角形 (Quán děng sānjiǎoxíng) - Congruent Triangles
* **四边形 (Sìbiānxíng)** - Quadrilateral
* 平行四边形 (Píngxíng sìbiānxíng) - Parallelogram
* 梯形 (Tīxíng) - Trapezoid
* **立体图形 (Lìtǐ túxíng)** - Solid Figures
* 圆锥 (Yuánzhuī) - Cone
### Key Observations
* The chart provides a comprehensive overview of mathematical topics, categorized into five main areas.
* Each main category is further divided into sub-topics, providing a hierarchical structure.
* The visual representation allows for easy identification of related concepts.
### Interpretation
The circular chart serves as a visual aid for organizing and understanding the relationships between different mathematical concepts. It is designed to provide a high-level overview of the subject matter, making it easier to navigate and comprehend the connections between various topics. The chart could be used for studying, curriculum planning, or as a reference tool for students and educators. The hierarchical structure allows users to drill down from broad categories to specific sub-topics, facilitating a deeper understanding of the subject matter.
DECODING INTELLIGENCE...