## Multi-Panel Line Chart: Training Metrics Comparison
### Overview
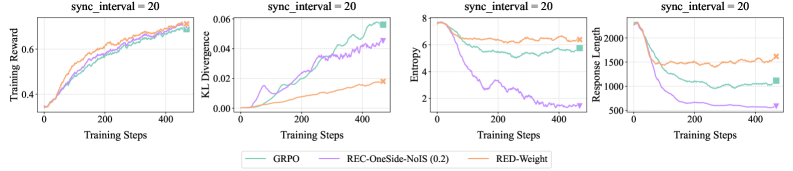
The image displays a set of four line charts arranged horizontally, comparing the performance of three different methods (GRPO, REC-OneSide-NoIS (0.2), and RED-Weight) across four distinct training metrics over 4000 training steps. All charts share the same title, "sync_interval = 20", and a common legend at the bottom.
### Components/Axes
* **Common Title (Top of each chart):** `sync_interval = 20`
* **X-Axis (All charts):** Label: `Training Steps`. Scale: Linear, from 0 to 4000, with major ticks at 0, 2000, and 4000.
* **Legend (Bottom center of the image):** Contains three entries with colored lines and text labels.
* Teal line: `GRPO`
* Purple line: `REC-OneSide-NoIS (0.2)`
* Orange line: `RED-Weight`
* **Chart 1 (Leftmost):**
* **Y-Axis Label:** `Training Reward`
* **Y-Axis Scale:** Linear, from approximately 0.3 to 0.8.
* **Chart 2 (Second from left):**
* **Y-Axis Label:** `KL Divergence`
* **Y-Axis Scale:** Linear, from 0.00 to 0.06.
* **Chart 3 (Third from left):**
* **Y-Axis Label:** `Entropy`
* **Y-Axis Scale:** Linear, from 0 to 8.
* **Chart 4 (Rightmost):**
* **Y-Axis Label:** `Response Length`
* **Y-Axis Scale:** Linear, from 500 to 2000.
### Detailed Analysis
**Chart 1: Training Reward**
* **Trend Verification:** All three lines show a clear, consistent upward trend, indicating increasing reward over training steps.
* **Data Points (Approximate at Step 4000):**
* GRPO (Teal): ~0.75
* REC-OneSide-NoIS (0.2) (Purple): ~0.73
* RED-Weight (Orange): ~0.78 (appears to be the highest)
* **Observation:** The lines are closely grouped, with RED-Weight showing a slight advantage in the later stages.
**Chart 2: KL Divergence**
* **Trend Verification:** GRPO (Teal) and REC-OneSide-NoIS (0.2) (Purple) show a strong upward trend. RED-Weight (Orange) shows a much more gradual, linear increase.
* **Data Points (Approximate at Step 4000):**
* GRPO (Teal): ~0.058
* REC-OneSide-NoIS (0.2) (Purple): ~0.045 (with notable fluctuations)
* RED-Weight (Orange): ~0.020
* **Observation:** There is a significant divergence in behavior. RED-Weight maintains a much lower KL divergence compared to the other two methods.
**Chart 3: Entropy**
* **Trend Verification:** GRPO (Teal) and RED-Weight (Orange) remain relatively stable with a slight downward drift. REC-OneSide-NoIS (0.2) (Purple) shows a dramatic, steep decline.
* **Data Points (Approximate at Step 4000):**
* GRPO (Teal): ~6.5
* REC-OneSide-NoIS (0.2) (Purple): ~1.5
* RED-Weight (Orange): ~6.8
* **Observation:** The REC-OneSide-NoIS (0.2) method experiences a severe collapse in entropy, while the other two methods maintain high entropy.
**Chart 4: Response Length**
* **Trend Verification:** RED-Weight (Orange) is relatively stable. GRPO (Teal) shows a moderate decline. REC-OneSide-NoIS (0.2) (Purple) shows a very steep decline.
* **Data Points (Approximate at Step 4000):**
* GRPO (Teal): ~1000
* REC-OneSide-NoIS (0.2) (Purple): ~500
* RED-Weight (Orange): ~1500
* **Observation:** The response length for REC-OneSide-NoIS (0.2) halves over training, while RED-Weight maintains a consistent, longer length.
### Key Observations
1. **Performance vs. Stability Trade-off:** While all methods improve reward (Chart 1), they exhibit drastically different behaviors in auxiliary metrics (KL, Entropy, Length).
2. **REC-OneSide-NoIS (0.2) Anomaly:** This method shows a distinctive pattern: moderate reward gain coupled with a collapse in entropy and response length, and a high, fluctuating KL divergence. This suggests a potential "mode collapse" or over-optimization phenomenon.
3. **RED-Weight Stability:** The RED-Weight method appears the most stable, achieving the highest final reward while maintaining low KL divergence, high entropy, and stable response length.
4. **GRPO as a Middle Ground:** GRPO's performance generally falls between the other two methods across the stability metrics.
### Interpretation
This set of charts provides a multi-faceted view of reinforcement learning or fine-tuning dynamics for language models. The data suggests that optimizing solely for training reward (Chart 1) can lead to unintended consequences in model behavior, as revealed by the other metrics.
* **The REC-OneSide-NoIS (0.2) method** appears to be aggressively optimizing the reward function at the cost of the model's behavioral diversity (plummeting entropy) and verbosity (shorter responses). The high and volatile KL divergence indicates the model's output distribution is shifting significantly and unstably from its reference. This could lead to repetitive, narrow, or degenerate outputs despite good reward scores.
* **The RED-Weight method** demonstrates a more desirable training profile. It achieves superior reward while preserving the model's entropy (indicating maintained exploratory capacity or output diversity) and keeping its behavior closer to the reference model (low KL divergence). The stable response length suggests it is not achieving reward by simply making responses shorter or longer.
* **The GRPO method** shows a balanced but less optimal profile compared to RED-Weight.
In summary, the charts argue that **RED-Weight is the most robust training method** among the three presented, as it maximizes the primary objective (reward) without sacrificing the secondary characteristics (stability, diversity, and behavioral consistency) that are crucial for a useful and reliable language model. The visualization effectively uses multiple metrics to expose the hidden costs of different optimization strategies.