\n
## Bar Chart: Hits@1 Performance Comparison
### Overview
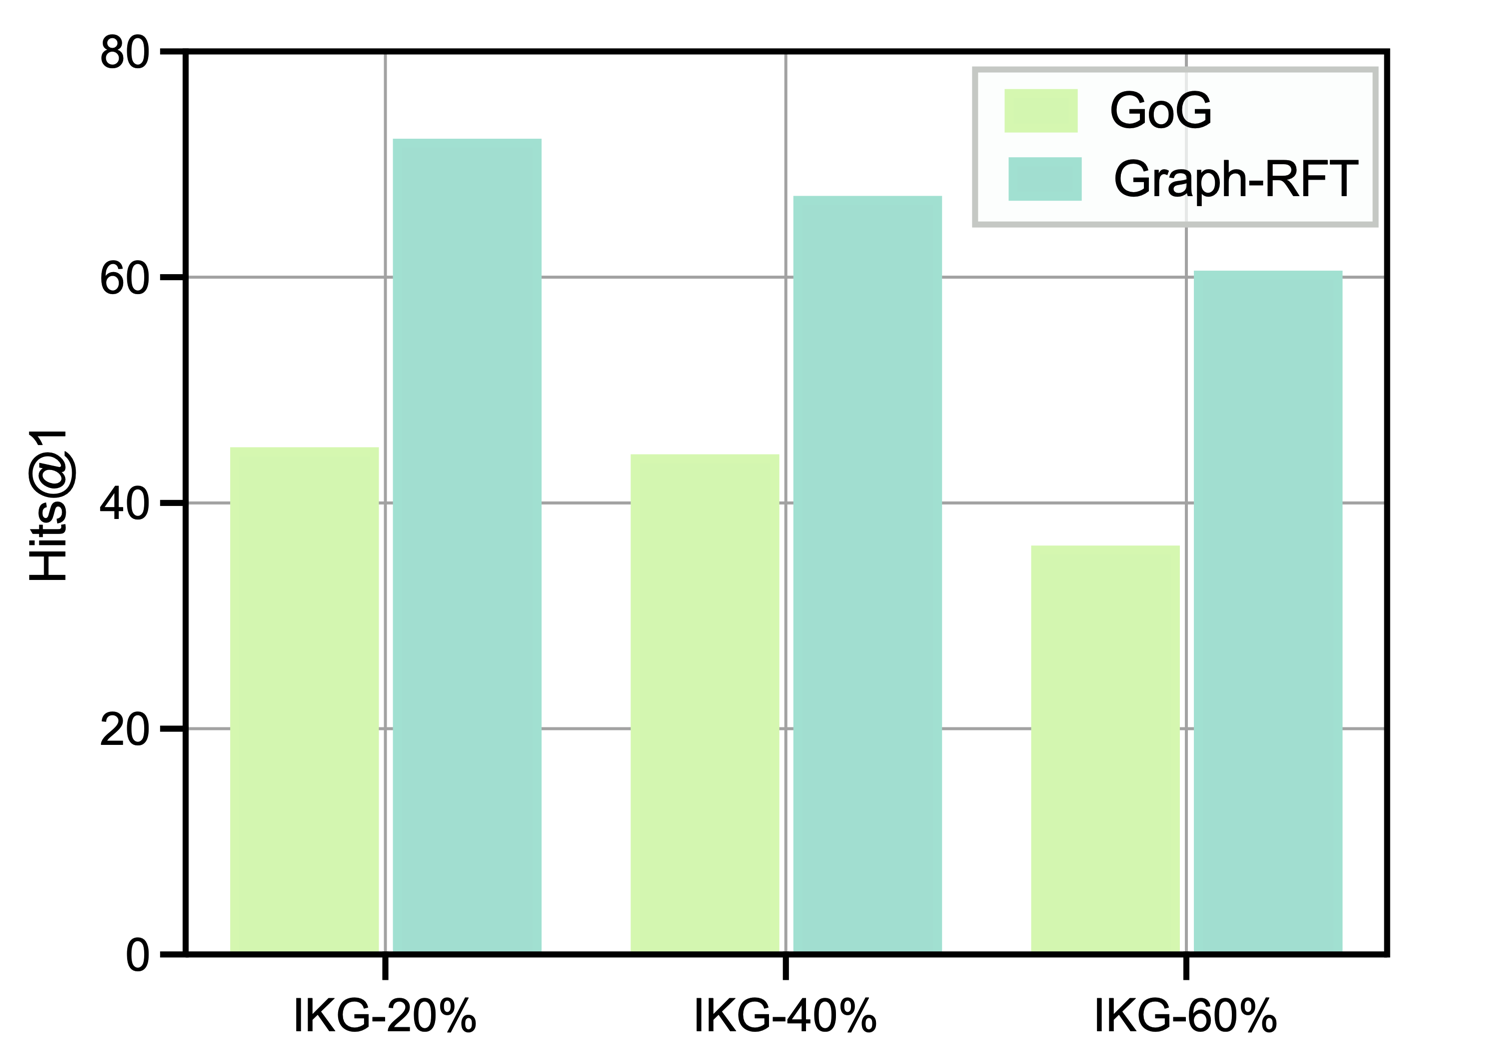
This bar chart compares the Hits@1 performance of two models, GoG and Graph-RFT, across three different IKGs (IKG-20%, IKG-40%, and IKG-60%). The chart uses bar groupings to visually represent the performance of each model for each IKG.
### Components/Axes
* **Y-axis:** "Hits@1" - Represents the performance metric, ranging from 0 to 80.
* **X-axis:** IKG levels: "IKG-20%", "IKG-40%", "IKG-60%"
* **Legend:** Located in the top-right corner.
* Yellow: "GoG"
* Light Green: "Graph-RFT"
* **Gridlines:** Horizontal gridlines are present to aid in reading the values.
### Detailed Analysis
The chart consists of six bars, grouped by IKG level.
* **IKG-20%:**
* GoG (Yellow): Approximately 48. The bar reaches slightly above the 40 mark, but is below the 50 mark.
* Graph-RFT (Light Green): Approximately 72. The bar reaches slightly below the 75 mark.
* **IKG-40%:**
* GoG (Yellow): Approximately 42. The bar reaches slightly above the 40 mark, but is below the 45 mark.
* Graph-RFT (Light Green): Approximately 68. The bar reaches slightly below the 70 mark.
* **IKG-60%:**
* GoG (Yellow): Approximately 32. The bar reaches slightly above the 30 mark, but is below the 35 mark.
* Graph-RFT (Light Green): Approximately 64. The bar reaches slightly below the 65 mark.
### Key Observations
* Graph-RFT consistently outperforms GoG across all three IKG levels.
* The performance of both models appears to decrease as the IKG percentage increases. The largest drop in performance is observed between IKG-40% and IKG-60% for both models.
* The difference in performance between the two models is most pronounced at the IKG-20% level.
### Interpretation
The data suggests that Graph-RFT is a more effective model than GoG for this particular task, as measured by Hits@1. The decreasing performance of both models as the IKG percentage increases could indicate that the task becomes more challenging with larger or more complex knowledge graphs. The initial high performance at IKG-20% and subsequent decline could be due to the models overfitting to the smaller knowledge graph, or that the added complexity of the larger graphs introduces noise or irrelevant information. The consistent outperformance of Graph-RFT suggests it may be more robust to these challenges. Further investigation would be needed to understand the specific reasons for these trends and to determine whether the observed differences are statistically significant.