## Bar Chart: Number of Files Across Categories
### Overview
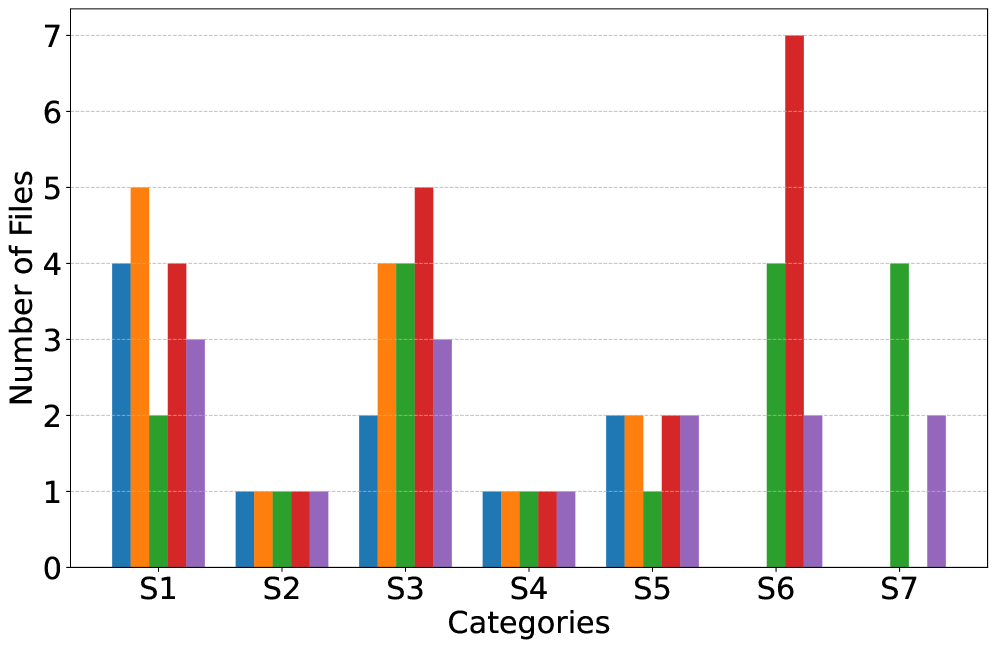
The chart displays a grouped bar visualization comparing the number of files across seven categories (S1–S7). Each category is represented by five colored bars (blue, orange, green, red, purple), with values ranging from 0 to 7 on the y-axis. The legend on the right maps colors to categories, though no explicit labels are provided for the colors themselves.
### Components/Axes
- **X-axis**: Labeled "Categories," with discrete labels S1–S7.
- **Y-axis**: Labeled "Number of Files," scaled from 0 to 7 in increments of 1.
- **Legend**: Positioned on the right, associating colors with categories (e.g., blue = S1, orange = S2, etc.). No explicit textual labels for colors are visible.
- **Bars**: Grouped vertically for each category, with approximate heights corresponding to the y-axis values.
### Detailed Analysis
- **S1**:
- Blue: ~4
- Orange: ~5
- Green: ~2
- Red: ~4
- Purple: ~3
- **S2**:
- All bars: ~1
- **S3**:
- Blue: ~2
- Orange: ~4
- Green: ~4
- Red: ~5
- Purple: ~3
- **S4**:
- All bars: ~1
- **S5**:
- Blue: ~2
- Orange: ~2
- Green: ~1
- Red: ~2
- Purple: ~2
- **S6**:
- Green: ~4
- Red: ~7
- Purple: ~2
- **S7**:
- Green: ~4
- Purple: ~2
### Key Observations
1. **S6** has the tallest bar (red, ~7), indicating the highest number of files in this category.
2. **S7** shows equal heights for green (~4) and purple (~2) bars, suggesting a tie or deliberate grouping.
3. **S2** and **S4** have uniformly low values (~1) across all colors, indicating minimal file counts.
4. **S3** has the second-highest red bar (~5), followed by S1 (~4).
5. **Green** and **purple** bars dominate S7, while **orange** and **red** dominate S1 and S3.
### Interpretation
The data suggests significant variability in file counts across categories. S6 stands out as an outlier with the highest value (~7), potentially indicating a critical or high-priority category. The uniformity in S2 and S4 (~1) may reflect baseline or control groups. The equal heights of green and purple bars in S7 could imply balanced contributions or a design choice. The legend’s placement on the right ensures clarity, though explicit color-to-category labels would enhance interpretability. The chart emphasizes categorical differences rather than trends, as no temporal or ordinal relationships are implied.