\n
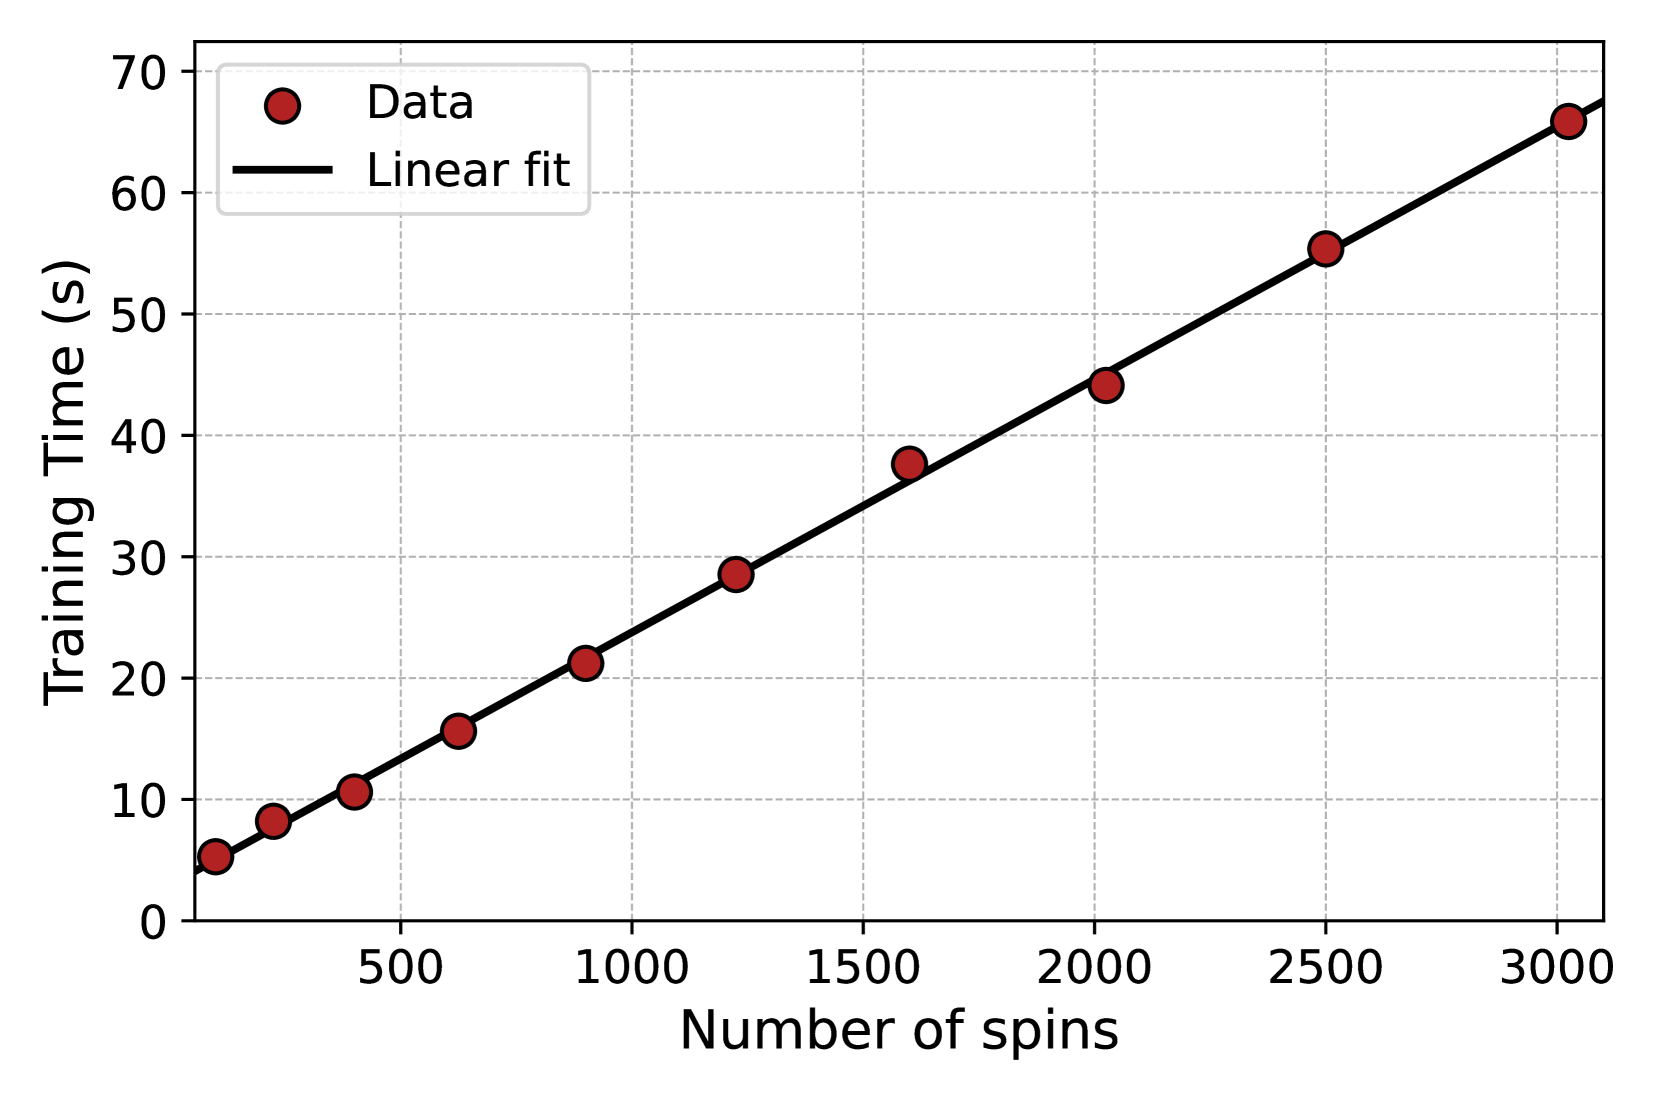
## Scatter Plot: Training Time vs. Number of Spins
### Overview
This image presents a scatter plot illustrating the relationship between the number of spins and the corresponding training time. A linear fit is overlaid on the data points. The plot aims to demonstrate how training time scales with the number of spins.
### Components/Axes
* **X-axis:** Number of spins, ranging from 0 to 3000, with tick marks at 500, 1000, 1500, 2000, 2500, and 3000.
* **Y-axis:** Training Time (s), ranging from 0 to 70, with tick marks at 0, 10, 20, 30, 40, 50, 60, and 70.
* **Data Points:** Represented by red circles, labeled "Data" in the top-left legend.
* **Linear Fit:** Represented by a black solid line, labeled "Linear fit" in the top-left legend.
* **Legend:** Located in the top-left corner, distinguishing between the data points and the linear fit.
* **Grid:** A light gray grid is present in the background to aid in reading values.
### Detailed Analysis
The data points generally follow an upward trend, indicating that as the number of spins increases, the training time also increases. The linear fit appears to closely approximate the trend of the data points.
Let's extract the approximate data points from the plot:
* (0, ~6.5)
* (500, ~13)
* (1000, ~21)
* (1500, ~29)
* (2000, ~44)
* (2500, ~58)
* (3000, ~68)
The linear fit starts at approximately (0, 6) and ends at approximately (3000, 66). The slope of the line appears to be roughly (66-6) / (3000-0) = 60/3000 = 0.02.
### Key Observations
* The relationship between the number of spins and training time appears to be approximately linear.
* The data points are relatively closely clustered around the linear fit, suggesting a strong correlation.
* There are no obvious outliers in the data.
* The training time increases consistently with the number of spins.
### Interpretation
The data suggests that the training time scales linearly with the number of spins. This implies that the computational cost of each spin is relatively constant. The linear fit provides a model for predicting the training time for a given number of spins. The consistency of the data and the close fit of the linear model suggest that this relationship is reliable within the observed range of spins. This could be used to estimate the time required for training with a larger number of spins, or to optimize the number of spins based on available training time. The intercept of the linear fit at approximately 6 seconds suggests a baseline training time even with zero spins, potentially representing overhead from initialization or other processes.