## Box Plot: Token Length Comparison Across Three Models
### Overview
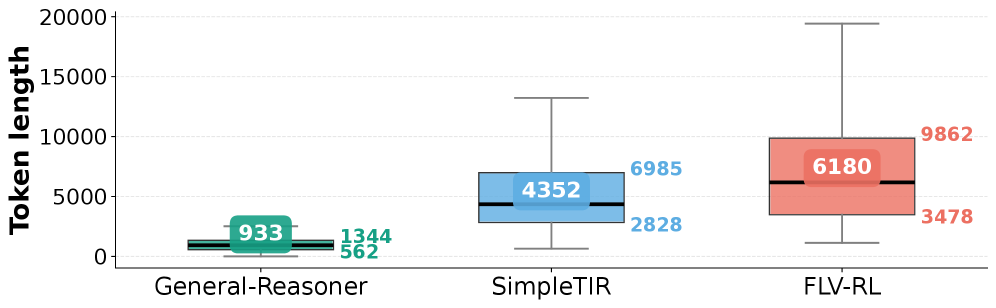
The image displays a box plot comparing the distribution of token lengths (in number of tokens) generated by three different models or systems: **General-Reasoner**, **SimpleTIR**, and **FLV-RL**. The chart visually summarizes the central tendency, spread, and range of token usage for each model.
### Components/Axes
* **Y-Axis:** Labeled **"Token length"**. The scale runs from 0 to 20,000, with major gridlines at intervals of 5,000 (0, 5000, 10000, 15000, 20000).
* **X-Axis:** Contains three categorical labels corresponding to the models being compared:
1. **General-Reasoner** (leftmost)
2. **SimpleTIR** (center)
3. **FLV-RL** (rightmost)
* **Legend/Data Labels:** The legend is integrated directly into each box plot, using color-coded text to display key statistical values. The colors match the fill of their respective boxes.
* **General-Reasoner (Teal):** Median = **933**, Upper Quartile (Q3) = **1344**, Lower Quartile (Q1) = **562**.
* **SimpleTIR (Light Blue):** Median = **4352**, Upper Quartile (Q3) = **6985**, Lower Quartile (Q1) = **2828**.
* **FLV-RL (Salmon):** Median = **6180**, Upper Quartile (Q3) = **9862**, Lower Quartile (Q1) = **3478**.
### Detailed Analysis
The plot consists of three vertical box-and-whisker plots, each representing the distribution of token lengths for one model.
1. **General-Reasoner (Teal Box, Left):**
* **Trend:** This model produces the shortest responses, with the most compact distribution.
* **Data Points:**
* **Median (line inside box):** 933 tokens.
* **Interquartile Range (IQR - the box):** Spans from 562 (Q1) to 1344 (Q3). The box height (IQR) is approximately 782 tokens.
* **Whiskers:** Extend from the box to the minimum and maximum values (excluding outliers). The lower whisker ends near 0. The upper whisker ends at approximately 2000 tokens (estimated visually, as no explicit label is given).
* **Spatial Grounding:** The teal box is positioned low on the y-axis, centered above the "General-Reasoner" label.
2. **SimpleTIR (Light Blue Box, Center):**
* **Trend:** Shows a moderate increase in both median token length and variability compared to General-Reasoner.
* **Data Points:**
* **Median:** 4352 tokens.
* **IQR:** Spans from 2828 (Q1) to 6985 (Q3). The IQR is approximately 4157 tokens.
* **Whiskers:** The lower whisker extends down to approximately 500 tokens. The upper whisker extends up to approximately 13,000 tokens (estimated visually).
* **Spatial Grounding:** The light blue box is positioned in the middle of the y-axis range, centered above the "SimpleTIR" label.
3. **FLV-RL (Salmon Box, Right):**
* **Trend:** This model has the highest median token length and the greatest spread (variability) in output length.
* **Data Points:**
* **Median:** 6180 tokens.
* **IQR:** Spans from 3478 (Q1) to 9862 (Q3). The IQR is approximately 6384 tokens, the largest of the three.
* **Whiskers:** The lower whisker extends down to approximately 1000 tokens. The upper whisker extends very high, to just below the 20,000 mark (estimated at ~19,500 tokens).
* **Spatial Grounding:** The salmon-colored box is positioned highest on the y-axis, centered above the "FLV-RL" label. Its upper whisker reaches the top region of the chart.
### Key Observations
1. **Clear Progression:** There is a distinct, stepwise increase in median token length from General-Reasoner (933) to SimpleTIR (4352) to FLV-RL (6180).
2. **Increasing Variability:** The spread of the data (IQR and whisker range) increases dramatically with each subsequent model. General-Reasoner's outputs are tightly clustered, while FLV-RL's outputs show extremely high variance, with some responses approaching 20,000 tokens.
3. **Overlap:** The IQR of SimpleTIR (2828-6985) significantly overlaps with the IQR of FLV-RL (3478-9862), indicating that while FLV-RL has a higher median, a substantial portion of its outputs are similar in length to those of SimpleTIR.
4. **Outlier Presence:** The long upper whisker on the FLV-RL plot suggests the presence of high-value outliers or a right-skewed distribution, meaning a small number of outputs are exceptionally long.
### Interpretation
This chart demonstrates a fundamental trade-off or characteristic difference between the three models. **General-Reasoner** appears optimized for **conciseness and efficiency**, producing short, predictable outputs. **SimpleTIR** represents a middle ground, generating moderately longer and more variable responses. **FLV-RL**, however, is characterized by **high verbosity and unpredictability**.
The data suggests that as the models potentially increase in complexity or capability (implied by the progression from "General" to "Simple" to "RL" in their names), they tend to generate significantly longer and more varied textual outputs. This could indicate:
* **Increased Reasoning Depth:** FLV-RL might be engaging in more extensive internal reasoning or exploration before producing a final answer.
* **Less Constraint:** The models may have different training objectives or constraints regarding response length.
* **Task Suitability:** General-Reasoner would be preferable for tasks requiring brevity (e.g., summarization, quick Q&A), while FLV-RL might be better suited for tasks requiring detailed explanation or complex problem-solving, albeit at a higher computational cost (due to token length).
The most critical takeaway is the **inverse relationship between output conciseness and variability** shown here: the model with the shortest median output is also the most consistent, while the model with the longest median output is the most erratic in its length.