## Diagram: Central Component "A" with Sequential Arrows
### Overview
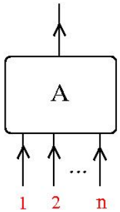
The image depicts a rectangular block labeled "A" at the center, with multiple upward-pointing arrows extending from its base. Each arrow is sequentially labeled with red text: "1", "2", ..., "n". The arrows are evenly spaced and aligned vertically beneath the rectangle.
### Components/Axes
- **Central Block**: A horizontally oriented rectangle labeled "A" in bold black text at its center.
- **Arrows**:
- Multiple vertical arrows originate from the bottom edge of the rectangle.
- Each arrow is labeled with a red integer: "1", "2", ..., "n" (where "n" represents an unspecified upper limit).
- Arrows are evenly spaced and aligned in a single column beneath the rectangle.
### Detailed Analysis
- **Labels**:
- The central block is explicitly labeled "A".
- Arrows are labeled with sequential integers starting at "1" and ending at "n", suggesting a countable or iterative process.
- **Spatial Relationships**:
- Arrows are positioned directly below the rectangle, maintaining vertical alignment.
- The sequence "1, 2, ..., n" implies a progression or hierarchy, though the exact nature (e.g., steps, inputs, outputs) is unspecified.
### Key Observations
- The diagram lacks numerical data, trends, or explicit contextual labels beyond "A" and the sequential integers.
- The upward direction of the arrows may imply flow, directionality, or dependency (e.g., inputs to "A", outputs from "A", or stages in a process).
- The use of "n" indicates a variable or scalable system, but no specific value is provided.
### Interpretation
This diagram likely represents a conceptual or abstract system where:
1. **Component "A"** serves as a central node or process.
2. The **sequential arrows (1 to n)** could symbolize:
- Inputs or resources fed into "A".
- Outputs or stages generated by "A".
- Iterative steps in a workflow or algorithm.
3. The absence of additional context (e.g., labels, units, or annotations) suggests the diagram is intentionally minimalist, focusing on structural relationships rather than quantitative details.
The upward direction of the arrows might imply causality, progression, or dependency, but without further context, this remains speculative. The diagram could apply to fields like systems engineering, data flow diagrams, or process modeling, where "A" acts as a hub and the arrows represent connected elements.