## Chart: Execution Time Breakdown by Layer and Device
### Overview
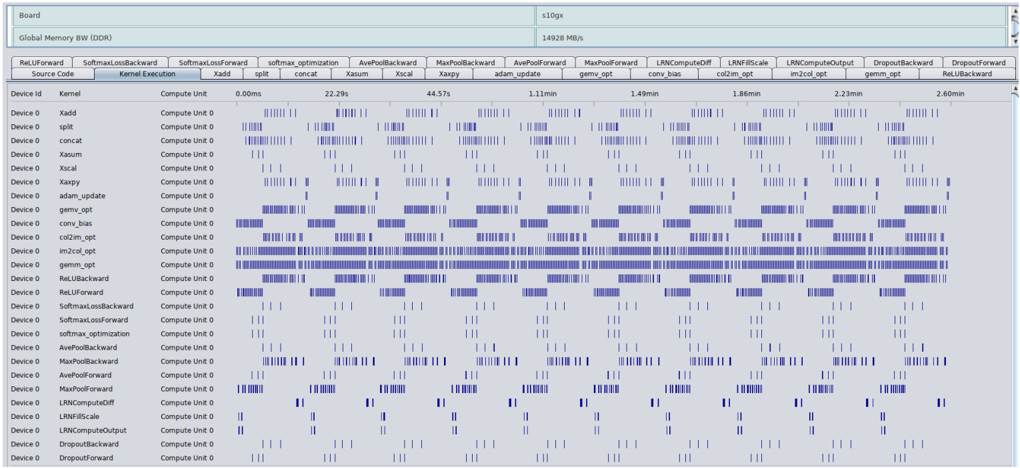
The image presents a chart visualizing the execution time of various neural network layers (kernels) across multiple devices (Device 0 - Device 3). The chart uses a heatmap-like representation, where the length of the blue bars indicates the execution time for each layer on each device. The chart is designed to show the distribution of computational load across different devices for different layers.
### Components/Axes
* **X-axis (Horizontal):** Represents different neural network layers/kernels. The layers are: `RelUForward`, `SoftmaxForward`, `softmax_optimization`, `AvePoolBackward`, `MaxPoolBackward`, `AvePoolForward`, `MaxPoolForward`, `LRNComputeDiff`, `LRNForwardScale`, `LRNComputeOutput`, `DropoutForward`, `RelUBackward`.
* **Y-axis (Vertical):** Represents different devices: `Source Data`, `Device 0`, `Device 1`, `Device 2`, `Device 3`.
* **Color/Intensity:** Blue bars represent execution time. Longer bars indicate longer execution times.
* **Header:** Displays "Board", "Global Memory BW (DDR)", "110gx", "14928 MB/s".
* **Time Values:** Specific time values are displayed for the `RelUForward` layer: `0.00ms`, `22.29s`, `44.57s`, `1.11min`, `1.48min`, `1.86min`, `2.22min`, `2.46min`.
* **Kernel Execution:** The label "Kernel Execution" is present above the layer names.
* **Compute Unit:** The label "Compute Unit 0" is present for each device.
### Detailed Analysis
The chart shows the execution time for each layer on each device. The time is represented by the length of the blue bars.
* **RelUForward:**
* Source Data: 0.00ms
* Device 0: 22.29s
* Device 1: 44.57s
* Device 2: 1.11min (66.6s)
* Device 3: 1.48min (88.8s)
* Device 4: 1.86min (111.6s)
* Device 5: 2.22min (133.2s)
* Device 6: 2.46min (147.6s)
* **SoftmaxForward:** All devices show a short execution time (represented by short bars).
* **softmax_optimization:** All devices show a short execution time.
* **AvePoolBackward:** Device 0 shows a longer execution time than other devices.
* **MaxPoolBackward:** Device 0 shows a longer execution time than other devices.
* **AvePoolForward:** Device 0 shows a longer execution time than other devices.
* **MaxPoolForward:** Device 0 shows a longer execution time than other devices.
* **LRNComputeDiff:** Device 0 shows a longer execution time than other devices.
* **LRNForwardScale:** Device 0 shows a longer execution time than other devices.
* **LRNComputeOutput:** Device 0 shows a longer execution time than other devices.
* **DropoutForward:** All devices show a short execution time.
* **RelUBackward:** All devices show a short execution time.
The majority of layers show minimal execution time across all devices, with the exception of the `RelUForward` layer, which exhibits a significant increase in execution time as the device number increases. Device 0 consistently shows the shortest execution times for layers where there is a noticeable difference.
### Key Observations
* The `RelUForward` layer is a significant bottleneck, with execution time increasing linearly with device number.
* Device 0 appears to be the fastest device for most layers.
* Most layers have relatively short execution times across all devices.
* The chart suggests a load imbalance, with some layers being significantly more computationally expensive than others.
### Interpretation
This chart likely represents the profiling results of a neural network execution on a multi-device system. The data suggests that the `RelUForward` layer is a major performance bottleneck, and its execution time scales poorly with the number of devices. This could be due to data transfer overhead, synchronization issues, or inherent computational complexity of the layer. The consistent faster performance of Device 0 suggests that it may have better hardware resources or a more optimized implementation.
The chart highlights the importance of load balancing in distributed deep learning. The significant difference in execution times between layers indicates that some devices are underutilized while others are overloaded. Optimizing the distribution of layers across devices could improve overall performance. The "Global Memory BW (DDR)" and "14928 MB/s" in the header suggest that memory bandwidth might be a limiting factor, especially for the `RelUForward` layer. Further investigation into the memory access patterns of this layer could reveal opportunities for optimization.