TECHNICAL ASSET FINGERPRINT
d2ba56e87245fd7535e36feb
Click to view fullscreen
Press ESC or click to close
FOUND IN PAPERS
EXPERT: gemini-2.5-flash-free VERSION 1
RUNTIME: google-free/gemini-2.5-flash
INTEL_VERIFIED
## Chart: Mean Pass Rate vs. Mean Number of Tokens Generated
### Overview
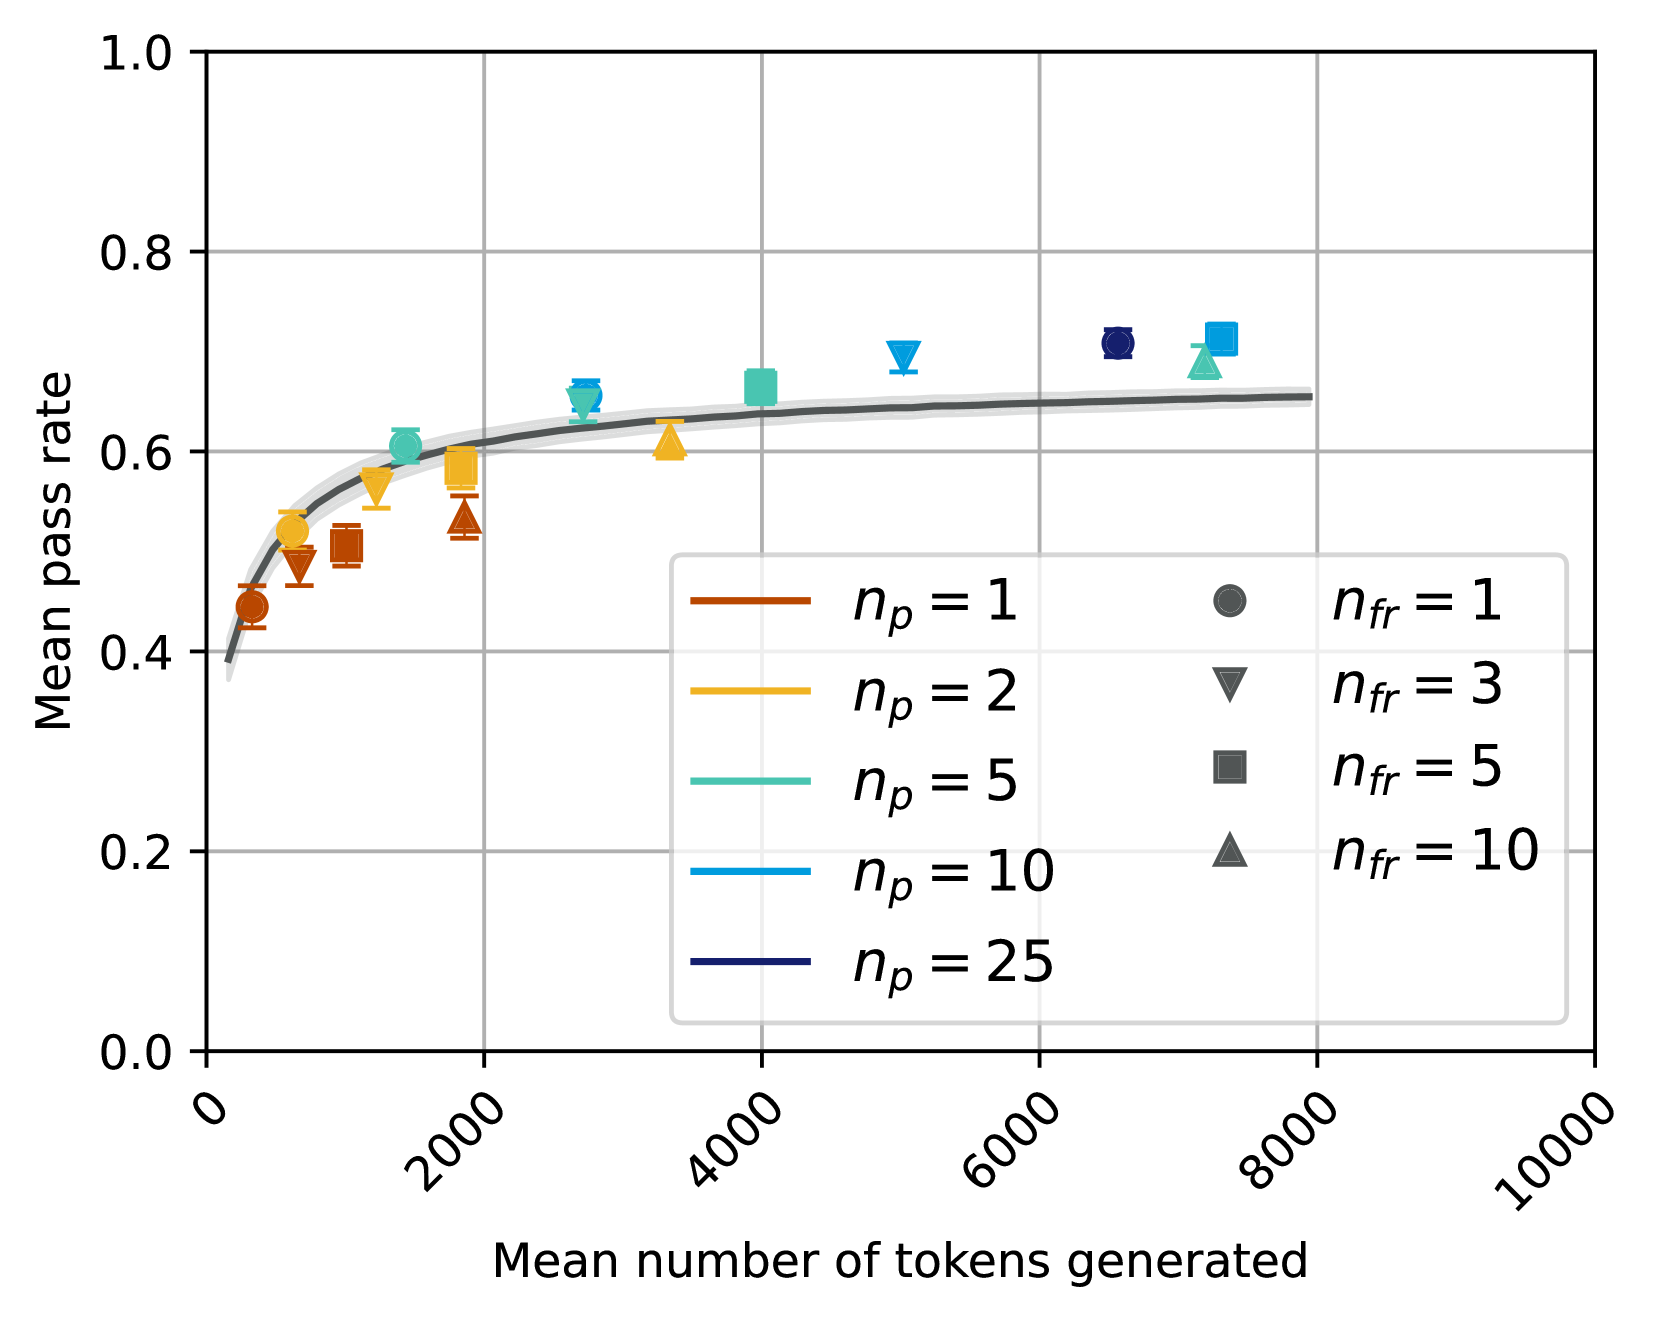
This image displays a 2D scatter plot with error bars, overlaid with a single dark grey line and a lighter grey shaded region representing an overall trend. The chart illustrates the relationship between the "Mean number of tokens generated" (X-axis) and the "Mean pass rate" (Y-axis), with individual data points categorized by two parameters: `n_p` (represented by color) and `n_fr` (represented by shape).
### Components/Axes
The chart is structured with a main plotting area, an X-axis at the bottom, a Y-axis on the left, and a legend in the bottom-right quadrant.
* **X-axis Label**: "Mean number of tokens generated"
* **Range**: From 0 to 10000.
* **Major Ticks**: Labeled at 0, 2000, 4000, 6000, 8000, and 10000. The labels are rotated approximately 45 degrees counter-clockwise.
* **Minor Ticks**: Not explicitly labeled, but grid lines suggest intermediate divisions.
* **Y-axis Label**: "Mean pass rate"
* **Range**: From 0.0 to 1.0.
* **Major Ticks**: Labeled at 0.0, 0.2, 0.4, 0.6, 0.8, and 1.0.
* **Minor Ticks**: Not explicitly labeled, but grid lines suggest intermediate divisions.
* **Grid**: A light grey grid is present, aligning with the major tick marks on both axes.
* **Legend (bottom-right quadrant)**: The legend is divided into two columns.
* **Left Column (`n_p` values, represented by line colors in the legend, which correspond to point colors in the plot)**:
* Brown line: `n_p = 1`
* Golden line: `n_p = 2`
* Teal line: `n_p = 5`
* Light blue line: `n_p = 10`
* Dark blue line: `n_p = 25`
* **Right Column (`n_fr` values, represented by grey shapes in the legend, which correspond to point shapes in the plot)**:
* Grey circle: `n_fr = 1`
* Grey downward triangle: `n_fr = 3`
* Grey square: `n_fr = 5`
* Grey upward triangle: `n_fr = 10`
* **Overall Trend Line**: A solid dark grey line with a surrounding lighter grey shaded region (likely indicating a confidence interval or standard deviation) is plotted across the chart.
### Detailed Analysis
The chart shows a general trend where the "Mean pass rate" increases with the "Mean number of tokens generated" up to a certain point, after which it appears to saturate. The individual data points, each with vertical error bars (approximately +/- 0.02 on the Y-axis), represent specific configurations of `n_p` and `n_fr`.
**Overall Trend Line (Dark Grey with Shaded Region):**
* Starts around (X=0, Y=0.4).
* Steadily increases, passing through approximately (X=1000, Y=0.55), (X=2000, Y=0.6), (X=4000, Y=0.65).
* Flattens out, approaching a plateau around Y=0.66 to 0.68 for X values greater than approximately 4000.
* The shaded region around the line indicates a narrow band of uncertainty, suggesting a consistent trend.
**Individual Data Points (Colored by `n_p`, Shaped by `n_fr`):**
1. **`n_p = 1` (Brown points):**
* Brown circle (`n_fr = 1`): Approximately (X=250, Y=0.43).
* Brown downward triangle (`n_fr = 3`): Approximately (X=500, Y=0.48).
* Brown square (`n_fr = 5`): Approximately (X=1000, Y=0.51).
* Brown upward triangle (`n_fr = 10`): Approximately (X=1500, Y=0.52).
* **Trend**: For `n_p=1`, increasing `n_fr` from 1 to 10 generally leads to an increase in both tokens generated and mean pass rate, but the pass rate remains relatively low compared to other `n_p` values.
2. **`n_p = 2` (Golden points):**
* Golden circle (`n_fr = 1`): Approximately (X=700, Y=0.50).
* Golden downward triangle (`n_fr = 3`): Approximately (X=1500, Y=0.57).
* Golden square (`n_fr = 5`): Approximately (X=2000, Y=0.59).
* Golden upward triangle (`n_fr = 10`): Approximately (X=3500, Y=0.61).
* **Trend**: For `n_p=2`, increasing `n_fr` shows a consistent increase in tokens generated and a moderate increase in mean pass rate, reaching up to ~0.61.
3. **`n_p = 5` (Teal points):**
* Teal circle (`n_fr = 1`): Approximately (X=1500, Y=0.61).
* Teal downward triangle (`n_fr = 3`): Approximately (X=2500, Y=0.65).
* Teal square (`n_fr = 5`): Approximately (X=4000, Y=0.66).
* Teal upward triangle (`n_fr = 10`): Approximately (X=7500, Y=0.68).
* **Trend**: For `n_p=5`, increasing `n_fr` results in a substantial increase in tokens generated and a good improvement in mean pass rate, approaching the saturation level.
4. **`n_p = 10` (Light blue points):**
* Light blue circle (`n_fr = 1`): Approximately (X=2000, Y=0.62).
* Light blue downward triangle (`n_fr = 3`): Approximately (X=5000, Y=0.69).
* Light blue square (`n_fr = 5`): Approximately (X=7000, Y=0.70).
* Light blue upward triangle (`n_fr = 10`): Approximately (X=7500, Y=0.69).
* **Trend**: For `n_p=10`, increasing `n_fr` generally increases tokens generated and achieves high mean pass rates, with `n_fr=5` reaching the highest point for this `n_p` at ~0.70. The `n_fr=10` point is slightly lower than `n_fr=5` at a similar token count.
5. **`n_p = 25` (Dark blue points):**
* Dark blue circle (`n_fr = 1`): Approximately (X=3000, Y=0.66).
* Dark blue downward triangle (`n_fr = 3`): Approximately (X=5500, Y=0.69).
* Dark blue square (`n_fr = 5`): Approximately (X=6500, Y=0.70).
* Dark blue upward triangle (`n_fr = 10`): Approximately (X=7000, Y=0.69).
* **Trend**: For `n_p=25`, increasing `n_fr` also increases tokens generated and achieves high mean pass rates, similar to `n_p=10` in the saturation region. The `n_fr=5` point is again the highest at ~0.70, with `n_fr=10` slightly lower.
### Key Observations
* **General Improvement**: The mean pass rate generally increases as the mean number of tokens generated increases, up to a point of diminishing returns.
* **Impact of `n_p`**: Higher values of `n_p` (represented by colors from brown to dark blue) consistently lead to higher mean pass rates for a given range of tokens generated. They also achieve higher pass rates with fewer tokens compared to lower `n_p` values. For example, `n_p=25` reaches a pass rate of ~0.66 at 3000 tokens, while `n_p=1` only reaches ~0.52 at 1500 tokens.
* **Impact of `n_fr`**: For a fixed `n_p`, increasing `n_fr` (represented by shapes from circle to upward triangle) generally corresponds to an increase in the mean number of tokens generated and a corresponding increase in the mean pass rate. This suggests `n_fr` influences the "effort" (tokens) and "reward" (pass rate).
* **Saturation**: All series of points appear to converge towards a maximum mean pass rate between approximately 0.68 and 0.70, regardless of further increases in tokens generated beyond ~5000-7000.
* **Efficiency**: Higher `n_p` values demonstrate better efficiency, achieving higher pass rates with fewer tokens. For instance, `n_p=25` (dark blue circle) achieves a pass rate of ~0.66 with ~3000 tokens, which is a pass rate that `n_p=5` (teal square) only reaches with ~4000 tokens.
* **Error Bars**: The error bars are consistently small and of similar magnitude across all data points, suggesting relatively low variability or high confidence in the mean pass rate measurements.
### Interpretation
The data presented in this chart suggests a performance characteristic of a system where `n_p` and `n_fr` are tunable parameters affecting the "Mean pass rate" and the "Mean number of tokens generated."
* **`n_p` as a Quality/Capability Parameter**: The parameter `n_p` appears to represent a fundamental capability or quality setting of the system. Higher `n_p` values lead to a better baseline performance, allowing the system to achieve higher pass rates more efficiently (i.e., with fewer tokens). This could imply that `n_p` controls the "power" or "intelligence" of the generation process.
* **`n_fr` as a Resource Allocation/Exploration Parameter**: The parameter `n_fr` seems to control the extent of resource allocation or exploration during token generation. Increasing `n_fr` generally pushes the system to generate more tokens, which in turn allows for a higher mean pass rate, especially for higher `n_p` values. This could represent the number of "tries" or "samples" taken during generation.
* **Diminishing Returns**: The overall trend and the saturation of individual series indicate that there are diminishing returns to simply generating more tokens. Beyond a certain point (around 5000-7000 tokens), the mean pass rate plateaus, suggesting that the system reaches its maximum potential for a given `n_p` value, and further token generation does not yield significant improvements.
* **Optimization Trade-off**: The chart highlights a critical trade-off for system design or operation. If the goal is to maximize the mean pass rate, one would aim for higher `n_p` values (e.g., `n_p=10` or `n_p=25`) and then select an `n_fr` value that pushes the tokens generated into the saturation region (e.g., `n_fr=3` or `n_fr=5` for `n_p=10` or `n_p=25`). However, if minimizing token generation is also a concern, one might choose a configuration like `n_p=10` with `n_fr=3` (5000 tokens, ~0.69 pass rate) over `n_p=25` with `n_fr=5` (6500 tokens, ~0.70 pass rate) if the slight difference in pass rate is acceptable for the token savings.
* **System Limits**: The observed plateau suggests an inherent upper limit to the "Mean pass rate" for the system or task being evaluated, regardless of how many tokens are generated, given the current range of `n_p` and `n_fr` values. This limit appears to be around 0.70.
DECODING INTELLIGENCE...