\n
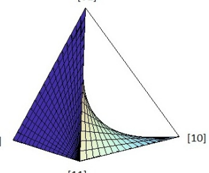
## 3D Surface Plot: Triangular Pyramid with Curved Surface
### Overview
The image depicts a 3D surface plot resembling a triangular pyramid with a curved surface replacing one of its faces. The plot is rendered with a grid-like mesh, and labeled with numerical values at the vertices. The surface appears to be defined by a mathematical function, creating a smooth, curved shape.
### Components/Axes
The plot is defined by three axes, labeled with the following values:
* **X-axis:** [1]
* **Y-axis:** [4]
* **Z-axis:** [10]
* **Base:** [4]
The plot is a triangular pyramid with a curved surface. The apex of the pyramid is at the point (1, 4, 10). The base of the pyramid is a triangle with vertices at approximately (1, 0, 0), (0, 4, 0), and (0, 0, 0). The curved surface replaces the face connecting the points (1, 0, 0), (0, 4, 0), and (0, 0, 0).
### Detailed Analysis or Content Details
The surface is a smooth curve that starts at a maximum height at the apex (1, 4, 10) and descends towards the base. The curvature is not uniform; it appears to be steeper near the x-axis and more gradual near the y-axis. The grid lines on the surface indicate a regular sampling of the function defining the surface.
The numerical labels at the vertices provide coordinate information. The apex is labeled as [1, 4, 10]. The base vertices are labeled as [1], [4], and [10].
### Key Observations
The plot demonstrates a surface that is defined by a function of two variables (likely x and y), with the height (z) being determined by the function's value at each point (x, y). The shape suggests a non-linear relationship between the input variables and the output height. The surface is smooth and continuous, indicating that the function is differentiable.
### Interpretation
The image represents a visualization of a mathematical function in three dimensions. The triangular pyramid shape with a curved surface suggests a function that is constrained by certain boundaries (the edges of the pyramid) but exhibits a smooth, continuous variation within those boundaries. The function could represent a variety of phenomena, such as a probability distribution, a physical surface, or a mathematical landscape. The specific shape of the curve would depend on the exact form of the function.
The plot is a visual representation of a mathematical concept, and its interpretation requires understanding the underlying function and its properties. Without knowing the function itself, it is difficult to draw definitive conclusions about the data it represents. However, the image provides a clear and intuitive visualization of a complex mathematical relationship.