## Scatter Plot Grid: Error vs. Causal Effect
### Overview
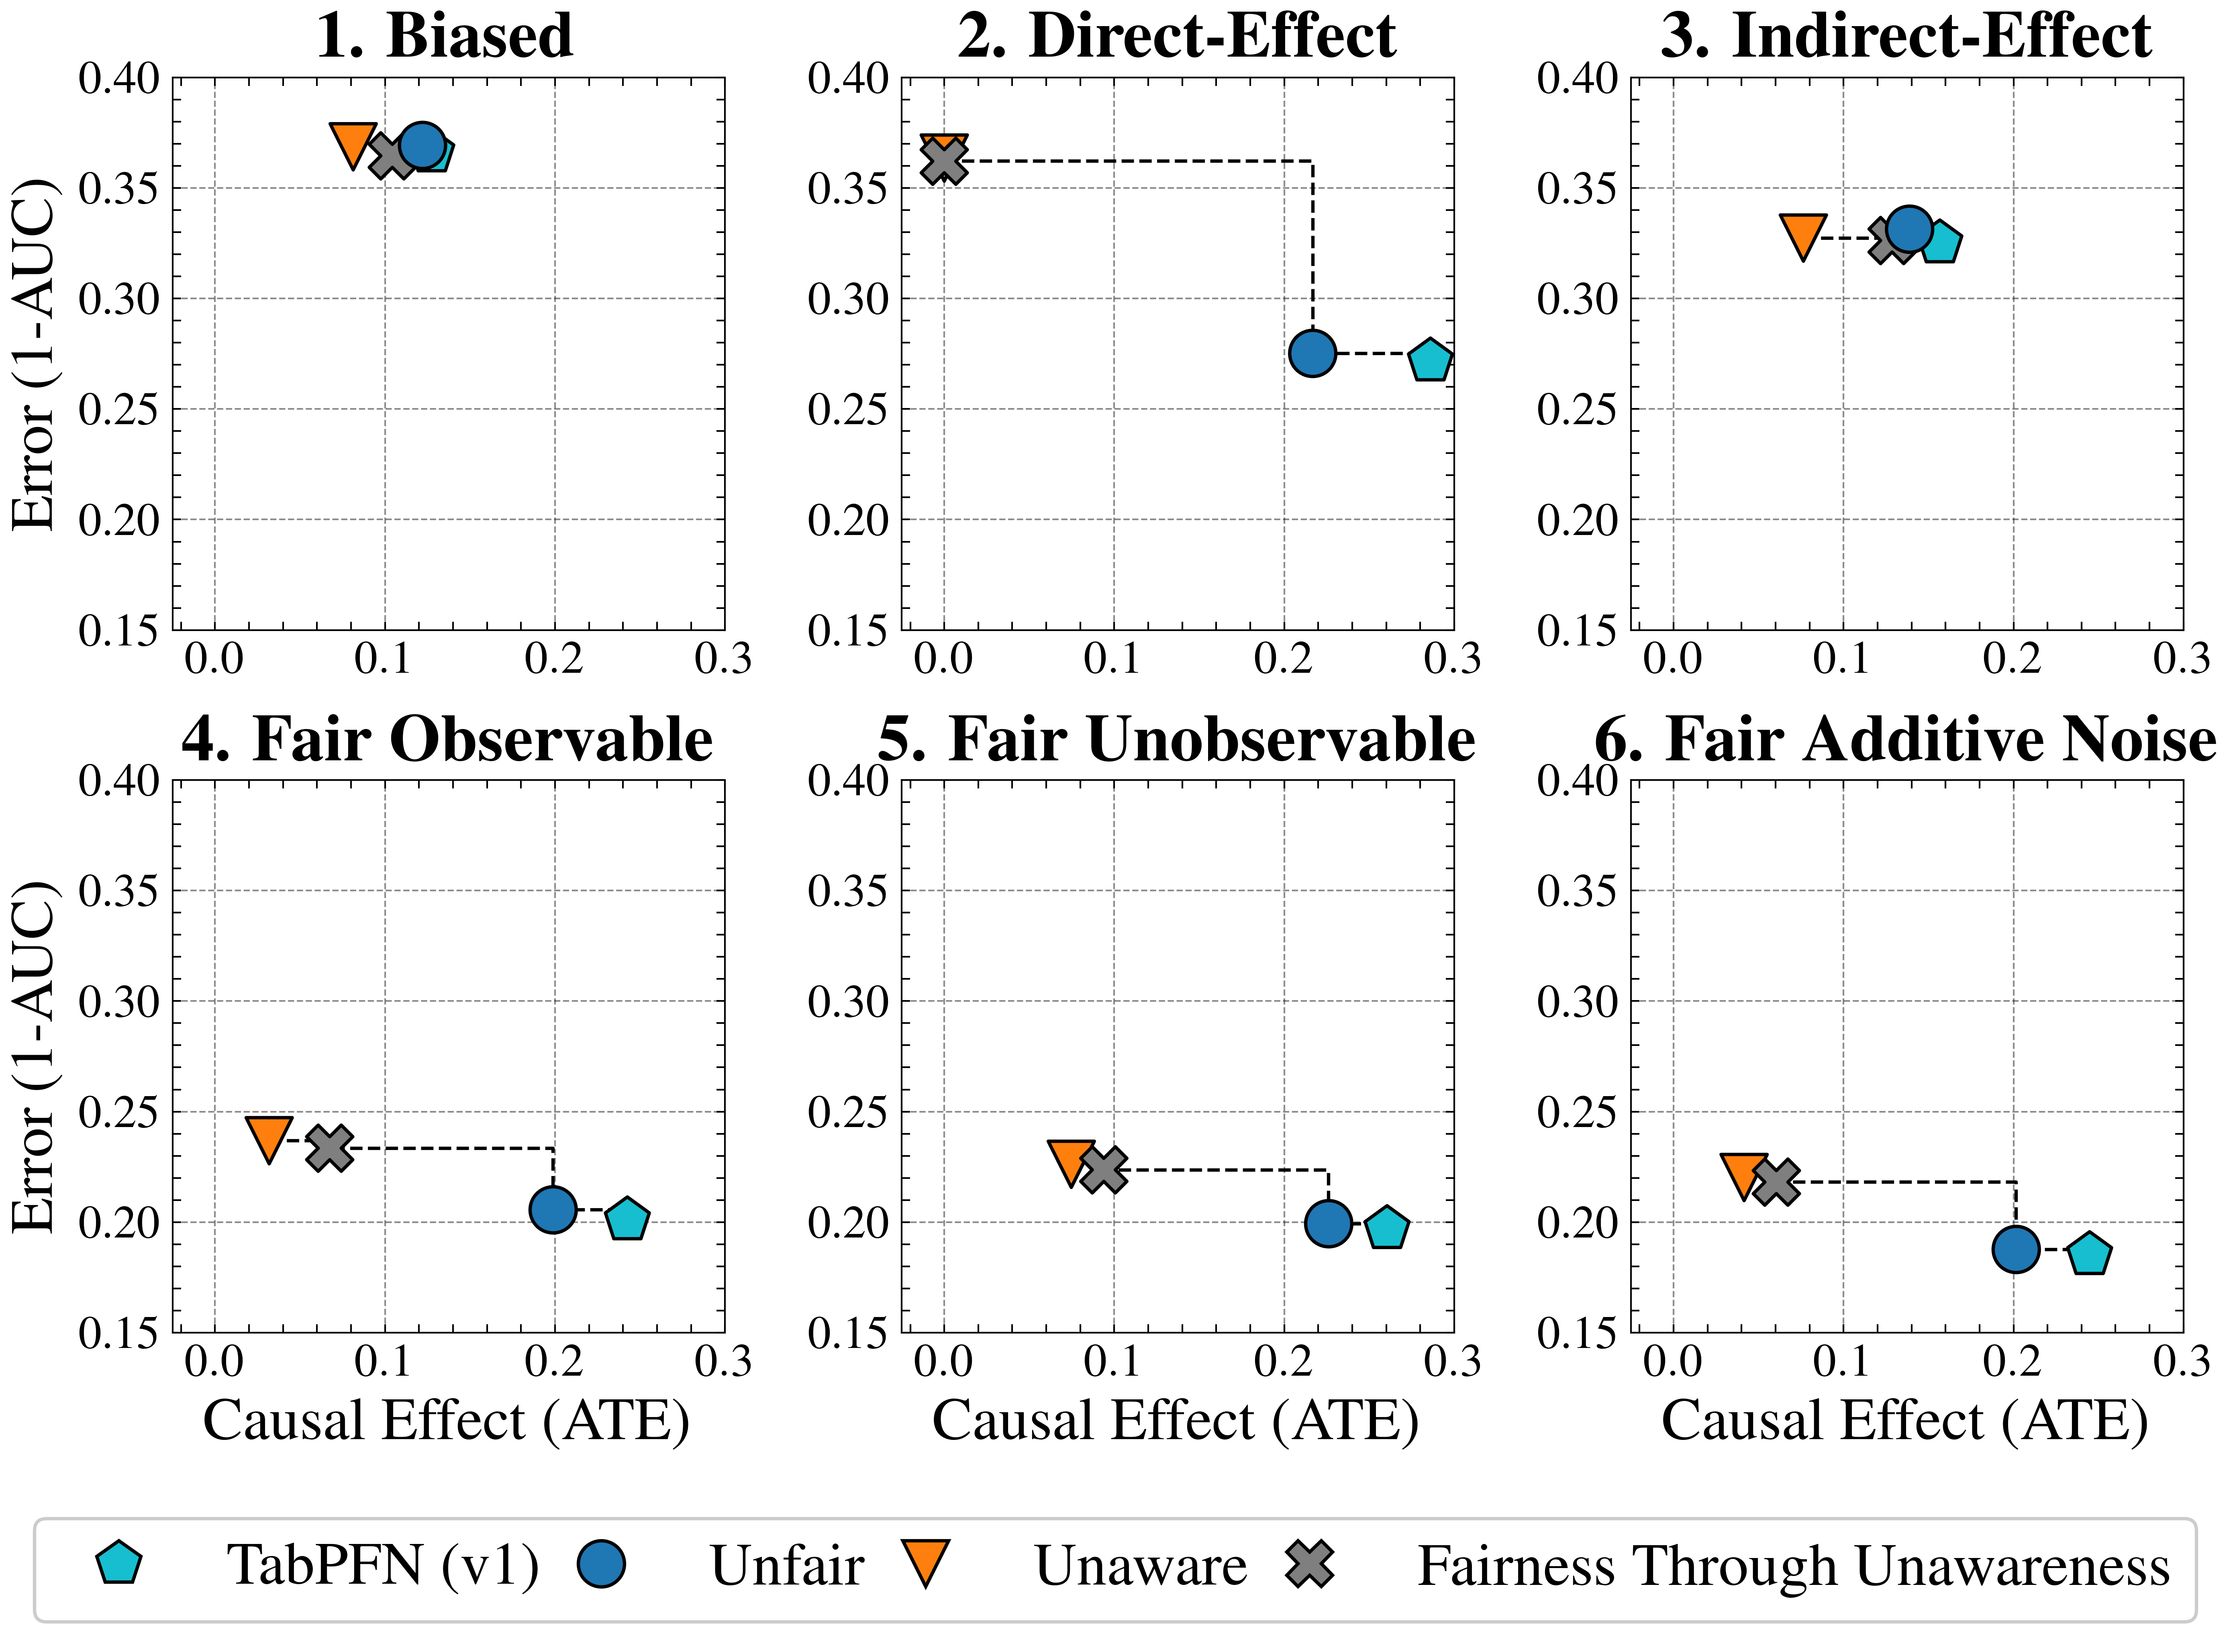
The image presents a grid of six scatter plots, each examining the relationship between "Error (1-AUC)" and "Causal Effect (ATE)" under different conditions: "Biased," "Direct-Effect," "Indirect-Effect," "Fair Observable," "Fair Unobservable," and "Fair Additive Noise." Each plot displays data points for four different methods: "TabPFN (v1)," "Unfair," "Unaware," and "Fairness Through Unawareness." The plots also include dashed lines connecting some of the data points, likely indicating a transition or comparison between different states or interventions.
### Components/Axes
* **Titles:** Each plot has a title indicating the condition being examined: "1. Biased," "2. Direct-Effect," "3. Indirect-Effect," "4. Fair Observable," "5. Fair Unobservable," and "6. Fair Additive Noise."
* **X-axis:** Labeled "Causal Effect (ATE)" with a scale from 0.0 to 0.3, incrementing by 0.1.
* **Y-axis:** Labeled "Error (1-AUC)" with a scale from 0.15 to 0.40, incrementing by 0.05.
* **Gridlines:** Each plot has gridlines at intervals of 0.05 on the y-axis and 0.1 on the x-axis.
* **Legend:** Located at the bottom of the image, mapping shapes and colors to methods:
* Light Blue Pentagon: "TabPFN (v1)"
* Blue Circle: "Unfair"
* Orange Down-pointing Triangle: "Unaware"
* Gray X: "Fairness Through Unawareness"
### Detailed Analysis
**Plot 1: Biased**
* "TabPFN (v1)": Causal Effect (ATE) ~0.15, Error (1-AUC) ~0.36
* "Unfair": Causal Effect (ATE) ~0.14, Error (1-AUC) ~0.37
* "Unaware": Causal Effect (ATE) ~0.09, Error (1-AUC) ~0.37
* "Fairness Through Unawareness": Causal Effect (ATE) ~0.10, Error (1-AUC) ~0.36
**Plot 2: Direct-Effect**
* "TabPFN (v1)": Causal Effect (ATE) ~0.29, Error (1-AUC) ~0.27
* "Unfair": Causal Effect (ATE) ~0.22, Error (1-AUC) ~0.28
* "Unaware": Causal Effect (ATE) ~0.01, Error (1-AUC) ~0.37
* "Fairness Through Unawareness": Causal Effect (ATE) ~0.01, Error (1-AUC) ~0.37
* A dashed line connects "Fairness Through Unawareness" to "Unfair" to "TabPFN (v1)".
**Plot 3: Indirect-Effect**
* "TabPFN (v1)": Causal Effect (ATE) ~0.17, Error (1-AUC) ~0.32
* "Unfair": Causal Effect (ATE) ~0.15, Error (1-AUC) ~0.33
* "Unaware": Causal Effect (ATE) ~0.07, Error (1-AUC) ~0.33
* "Fairness Through Unawareness": Causal Effect (ATE) ~0.11, Error (1-AUC) ~0.32
**Plot 4: Fair Observable**
* "TabPFN (v1)": Causal Effect (ATE) ~0.27, Error (1-AUC) ~0.21
* "Unfair": Causal Effect (ATE) ~0.20, Error (1-AUC) ~0.21
* "Unaware": Causal Effect (ATE) ~0.02, Error (1-AUC) ~0.24
* "Fairness Through Unawareness": Causal Effect (ATE) ~0.07, Error (1-AUC) ~0.24
* A dashed line connects "Fairness Through Unawareness" to "Unfair" to "TabPFN (v1)".
**Plot 5: Fair Unobservable**
* "TabPFN (v1)": Causal Effect (ATE) ~0.27, Error (1-AUC) ~0.20
* "Unfair": Causal Effect (ATE) ~0.20, Error (1-AUC) ~0.20
* "Unaware": Causal Effect (ATE) ~0.03, Error (1-AUC) ~0.23
* "Fairness Through Unawareness": Causal Effect (ATE) ~0.07, Error (1-AUC) ~0.23
**Plot 6: Fair Additive Noise**
* "TabPFN (v1)": Causal Effect (ATE) ~0.27, Error (1-AUC) ~0.19
* "Unfair": Causal Effect (ATE) ~0.20, Error (1-AUC) ~0.19
* "Unaware": Causal Effect (ATE) ~0.02, Error (1-AUC) ~0.22
* "Fairness Through Unawareness": Causal Effect (ATE) ~0.07, Error (1-AUC) ~0.23
* A dashed line connects "Unaware" to "Unfair" to "TabPFN (v1)".
### Key Observations
* The "Unaware" method consistently has the lowest "Causal Effect (ATE)" across all conditions.
* The "Biased" condition shows all methods clustered with relatively high "Error (1-AUC)" values.
* The dashed lines in plots 2, 4, and 6 suggest a progression or transformation from the "Fairness Through Unawareness" or "Unaware" method to the "Unfair" method, and finally to the "TabPFN (v1)" method, with corresponding changes in "Causal Effect (ATE)" and "Error (1-AUC)."
* The "Fair Additive Noise" condition appears to yield the lowest "Error (1-AUC)" for "TabPFN (v1)" and "Unfair" methods.
### Interpretation
The plots compare the performance of different methods in terms of "Error (1-AUC)" and "Causal Effect (ATE)" under various fairness conditions. The "Unaware" method consistently exhibits a low "Causal Effect (ATE)," potentially indicating a conservative approach that minimizes intervention. The dashed lines suggest that "Fairness Through Unawareness" and "Unaware" methods are initial states, which are then transformed into "Unfair" and finally "TabPFN (v1)" methods, possibly through some intervention or optimization process. The "Biased" condition highlights a scenario where all methods struggle to achieve both low error and high causal effect. The "Fair Additive Noise" condition seems to be the most favorable, allowing "TabPFN (v1)" and "Unfair" to achieve relatively low error. Overall, the data suggests that the choice of method and the specific fairness condition significantly impact the trade-off between error and causal effect.