\n
## Chart: Error (1-AUC) vs. Causal Effect (ATE) for Different Fairness Interventions
### Overview
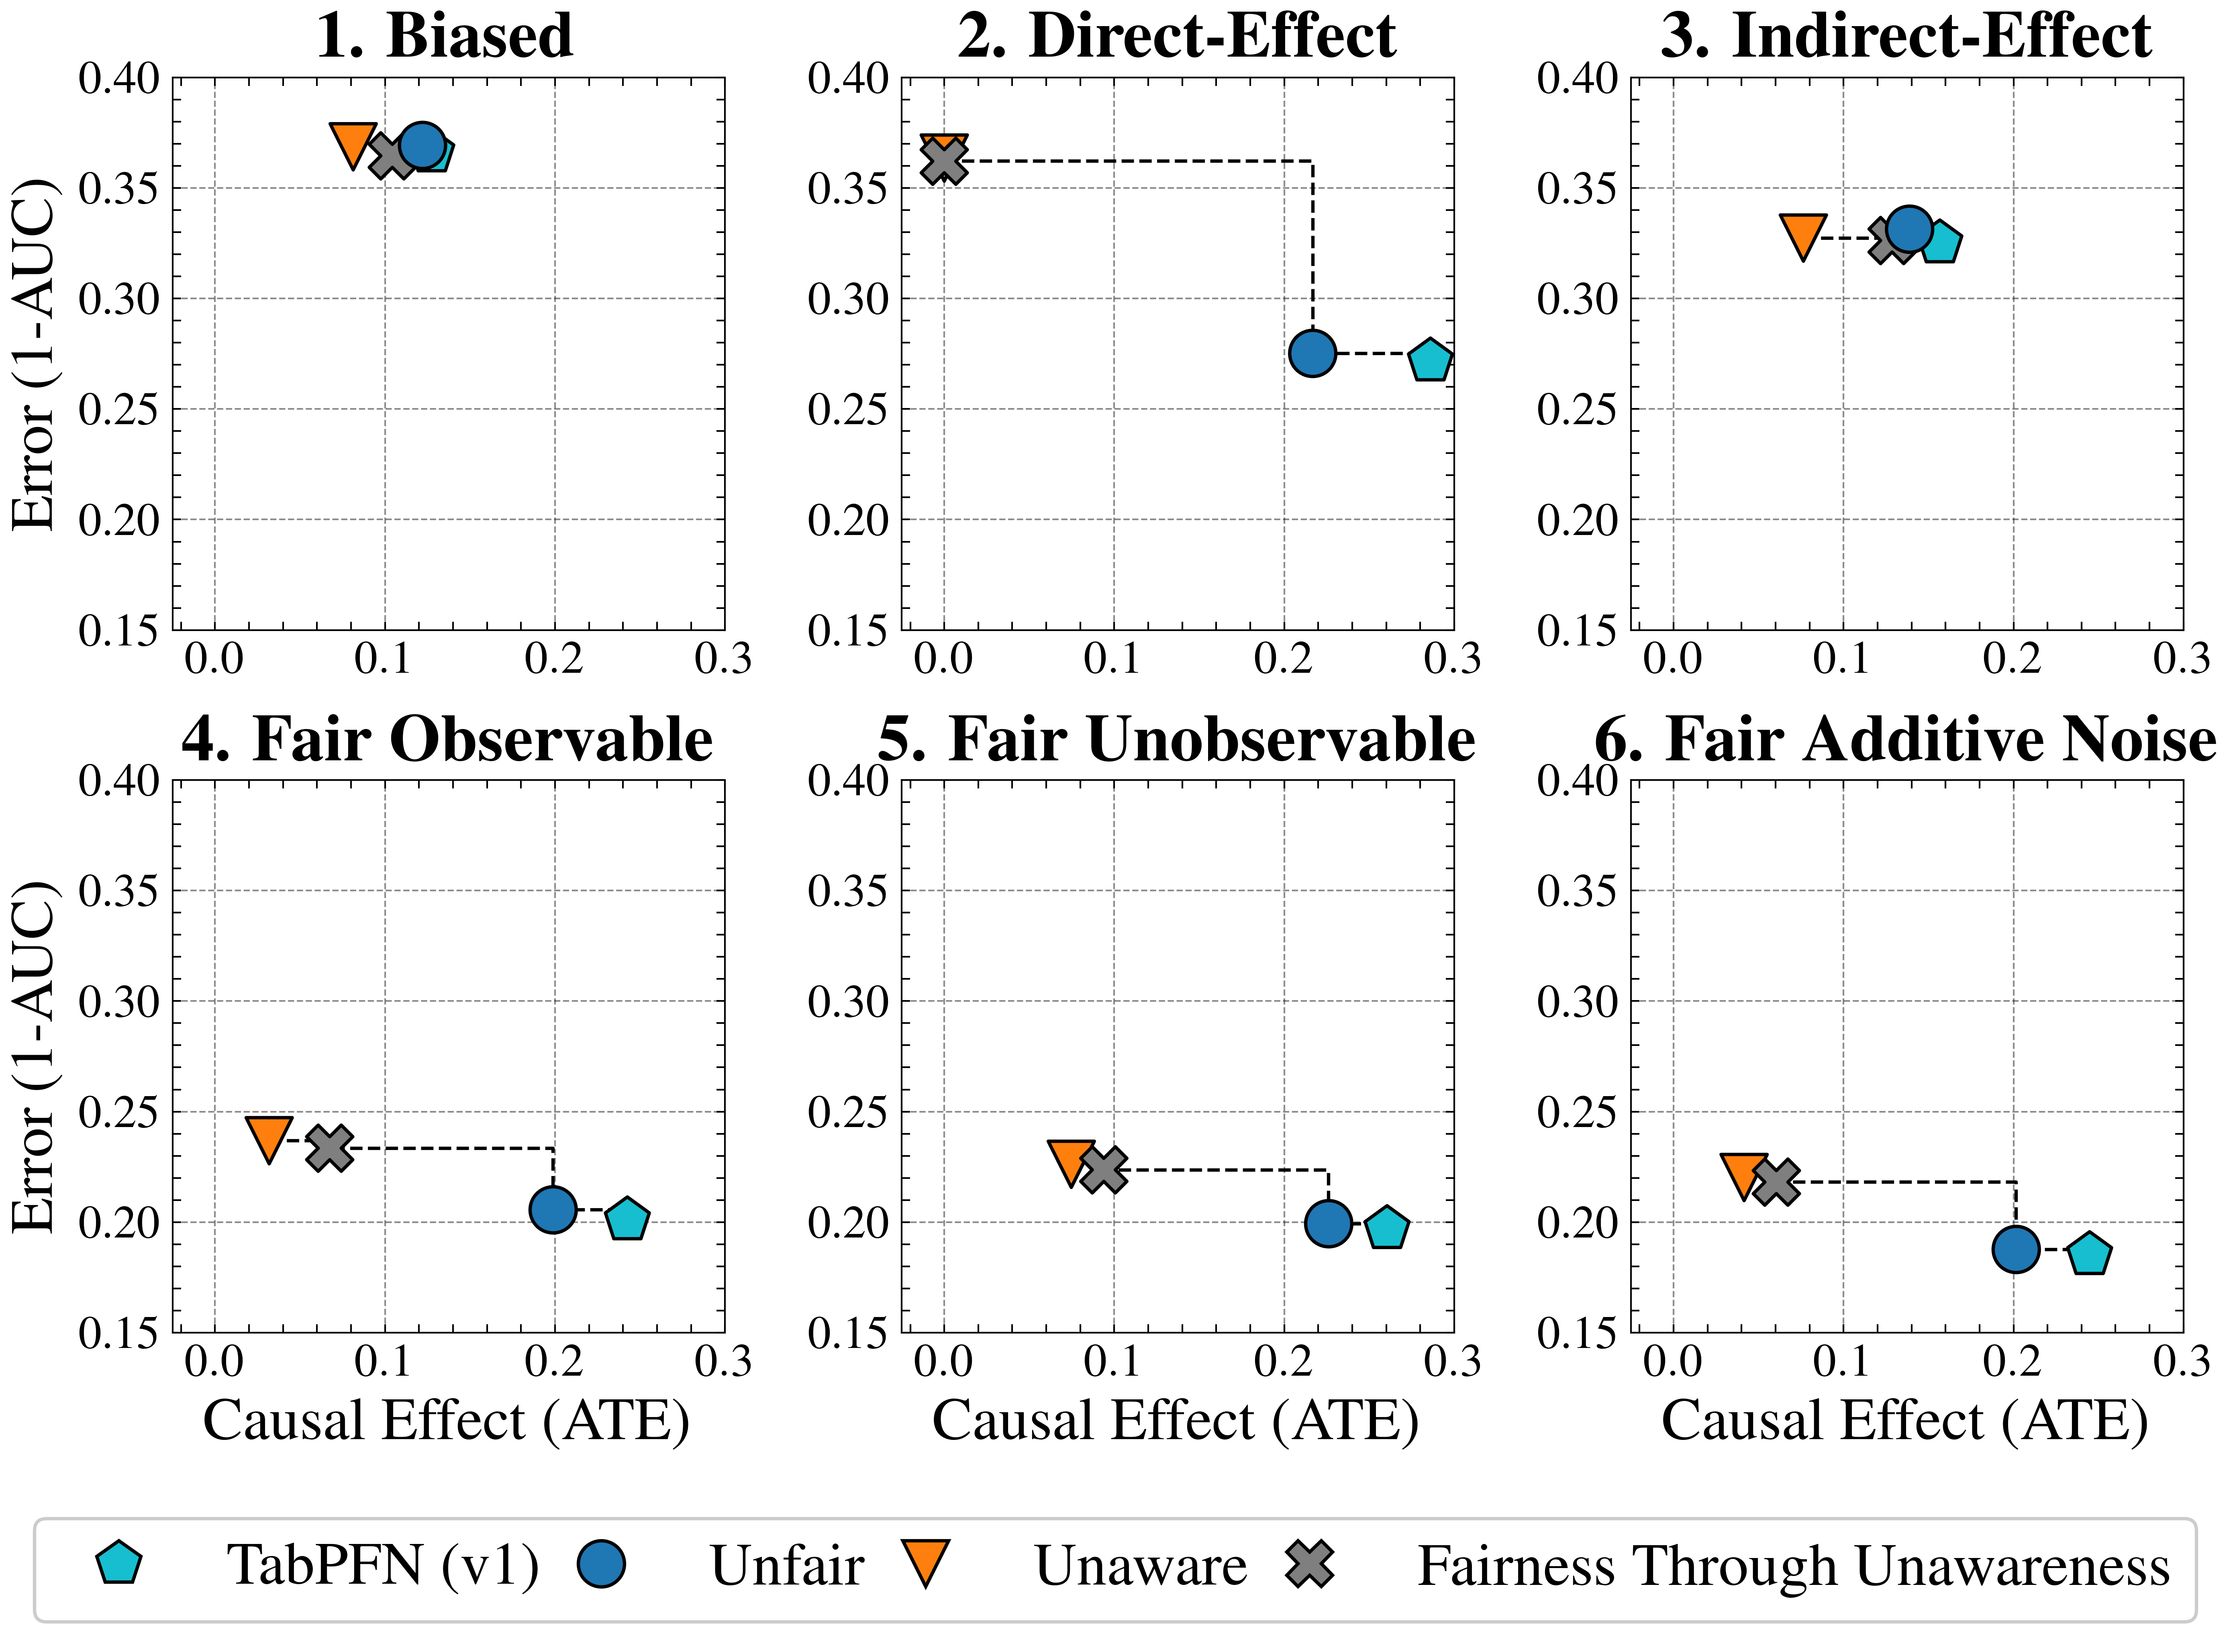
The image presents six separate scatter plots, each representing a different fairness intervention scenario. Each plot displays the relationship between "Error (1-AUC)" on the y-axis and "Causal Effect (ATE)" on the x-axis. Each plot includes data points for four different methods: TabPFN (v1), Unfair, Unaware, and Fairness Through Unawareness. Each data point is connected to the origin (0,0) with a dashed line. Error bars are also present.
### Components/Axes
* **X-axis Title:** Causal Effect (ATE) - Scale ranges from 0.0 to 0.3.
* **Y-axis Title:** Error (1-AUC) - Scale ranges from 0.15 to 0.40.
* **Plot Titles:**
1. Biased
2. Direct-Effect
3. Indirect-Effect
4. Fair Observable
5. Fair Unobservable
6. Fair Additive Noise
* **Legend:** Located at the bottom-center of the image.
* TabPFN (v1) - Represented by a green square.
* Unfair - Represented by a blue circle.
* Unaware - Represented by an orange downward-pointing triangle.
* Fairness Through Unawareness - Represented by a black cross.
### Detailed Analysis or Content Details
**1. Biased:**
* TabPFN (v1): Approximately (0.15, 0.36).
* Unfair: Approximately (0.25, 0.26).
* Unaware: Approximately (0.18, 0.33).
* Fairness Through Unawareness: Approximately (0.15, 0.28).
**2. Direct-Effect:**
* TabPFN (v1): Approximately (0.18, 0.34).
* Unfair: Approximately (0.25, 0.27).
* Unaware: Approximately (0.22, 0.29).
* Fairness Through Unawareness: Approximately (0.22, 0.26).
**3. Indirect-Effect:**
* TabPFN (v1): Approximately (0.15, 0.32).
* Unfair: Approximately (0.25, 0.28).
* Unaware: Approximately (0.18, 0.31).
* Fairness Through Unawareness: Approximately (0.22, 0.30).
**4. Fair Observable:**
* TabPFN (v1): Approximately (0.15, 0.24).
* Unfair: Approximately (0.25, 0.21).
* Unaware: Approximately (0.18, 0.23).
* Fairness Through Unawareness: Approximately (0.15, 0.21).
**5. Fair Unobservable:**
* TabPFN (v1): Approximately (0.15, 0.24).
* Unfair: Approximately (0.25, 0.20).
* Unaware: Approximately (0.22, 0.23).
* Fairness Through Unawareness: Approximately (0.18, 0.22).
**6. Fair Additive Noise:**
* TabPFN (v1): Approximately (0.15, 0.22).
* Unfair: Approximately (0.25, 0.18).
* Unaware: Approximately (0.22, 0.21).
* Fairness Through Unawareness: Approximately (0.18, 0.20).
In all plots, the dashed lines connect each data point to the origin (0,0). The error bars are relatively small and consistent across all plots.
### Key Observations
* The "Unfair" method consistently exhibits higher error rates than the other methods across all scenarios.
* TabPFN (v1) generally shows the lowest error rates, particularly in the "Fair" scenarios (4, 5, and 6).
* The "Unaware" and "Fairness Through Unawareness" methods perform similarly in most scenarios, with "Fairness Through Unawareness" sometimes showing slightly lower error.
* The causal effect (ATE) appears to have a weak positive correlation with error (1-AUC) for the "Unfair" method.
### Interpretation
The charts demonstrate the impact of different fairness interventions on the trade-off between error and causal effect. The "Unfair" method, as expected, results in the highest error rates, indicating a significant bias in the model's predictions. TabPFN (v1) consistently achieves the lowest error rates, suggesting its effectiveness in mitigating bias while maintaining accuracy. The "Unaware" and "Fairness Through Unawareness" methods offer a compromise between fairness and accuracy, with "Fairness Through Unawareness" potentially providing a slight improvement in fairness without significantly sacrificing accuracy.
The consistent connection of data points to the origin suggests that as the causal effect increases, so does the error, particularly for the "Unfair" method. This implies that simply increasing the causal effect without addressing fairness concerns can lead to higher error rates. The small error bars indicate that the results are relatively stable and reliable.
The different scenarios ("Biased," "Direct-Effect," "Indirect-Effect," etc.) represent different types of fairness challenges. The consistent performance of TabPFN (v1) across these scenarios suggests its robustness and generalizability. The charts provide valuable insights for practitioners seeking to develop fair and accurate machine learning models.