## Bar Chart: Mean Success Rates: Real World vs World Model
### Overview
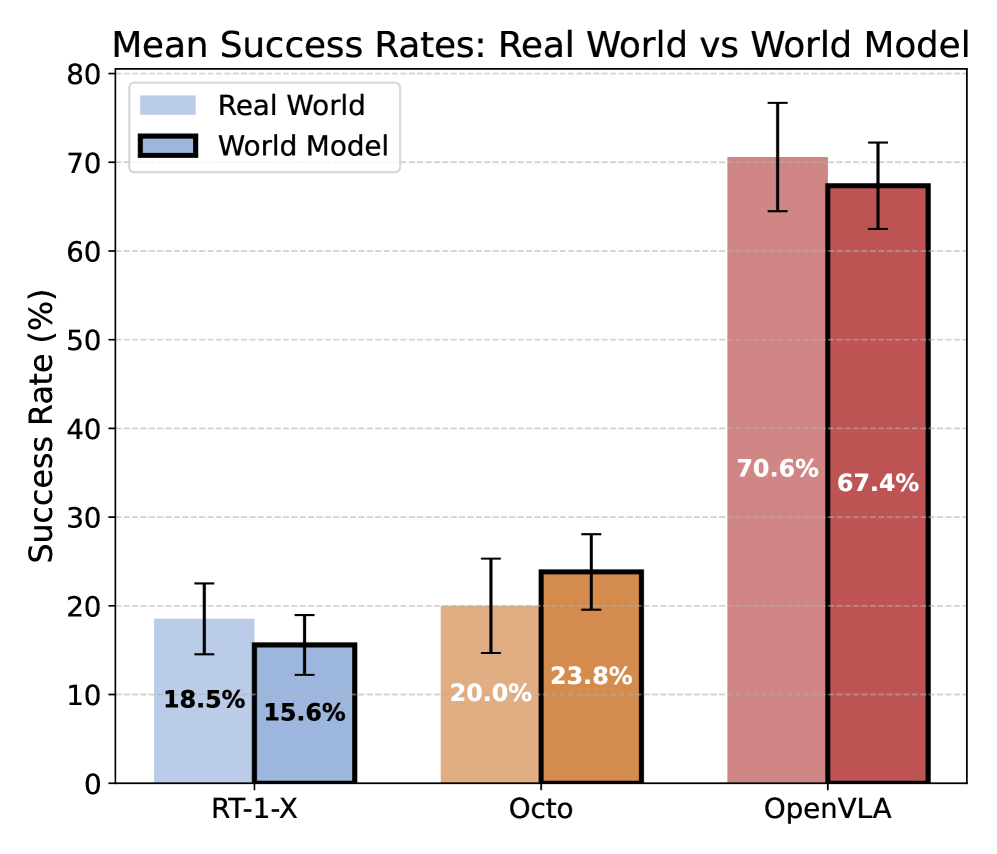
The chart compares mean success rates (%) between "Real World" and "World Model" across three categories: RT-1-X, Octo, and OpenVLA. Error bars indicate variability, with OpenVLA showing the largest uncertainty.
### Components/Axes
- **X-axis**: Categories (RT-1-X, Octo, OpenVLA)
- **Y-axis**: Success Rate (%) from 0 to 80 (increments of 10)
- **Legend**:
- Light blue = Real World
- Dark blue = World Model
- **Error Bars**: Vertical lines extending from each bar’s midpoint
### Detailed Analysis
1. **RT-1-X**:
- Real World: 18.5% (±3.2%)
- World Model: 15.6% (±2.8%)
2. **Octo**:
- Real World: 20.0% (±4.1%)
- World Model: 23.8% (±3.5%)
3. **OpenVLA**:
- Real World: 70.6% (±6.3%)
- World Model: 67.4% (±5.9%)
### Key Observations
- **Real World** consistently outperforms **World Model** in all categories.
- **OpenVLA** has the highest success rates but also the largest error margins.
- **RT-1-X** shows the lowest success rates and smallest error bars.
### Interpretation
The data suggests that "Real World" models achieve higher success rates than "World Model" counterparts across all tasks. OpenVLA demonstrates the greatest performance gap (3.2% difference) but also the highest variability, potentially indicating complex or edge-case scenarios. RT-1-X’s lower performance and smaller error bars may reflect simpler tasks or more stable model behavior. The error bars for OpenVLA suggest significant uncertainty, possibly due to smaller sample sizes or diverse real-world conditions.