## Line Chart: 10x10 Maze: Grid Ablation
### Overview
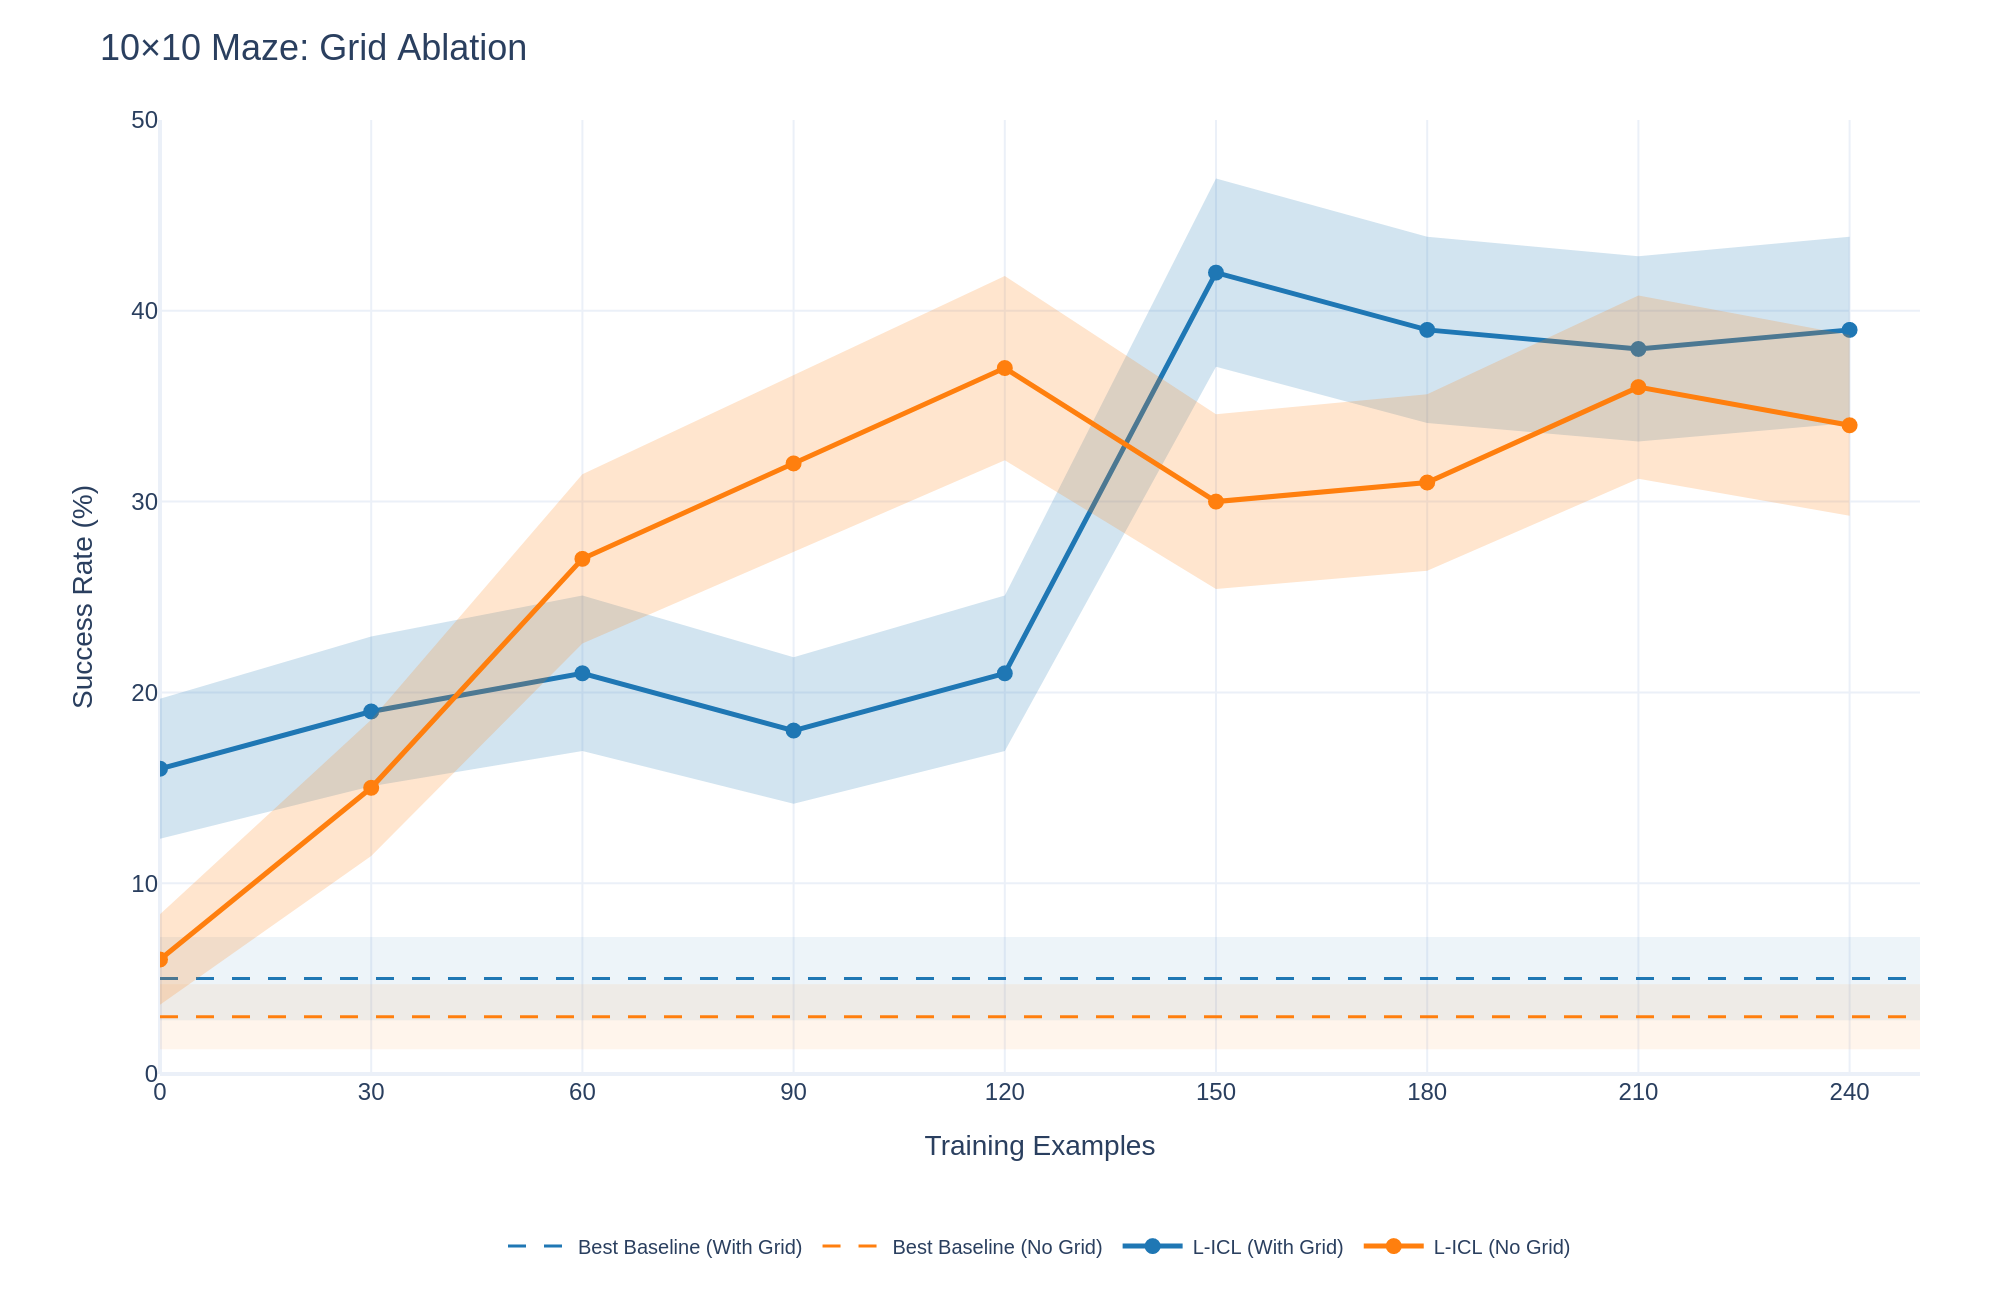
The image is a line chart comparing the success rate (%) of different models (L-ICL and Best Baseline) with and without a grid, across varying numbers of training examples. The x-axis represents the number of training examples, and the y-axis represents the success rate in percentage. Shaded regions around the lines indicate variability or confidence intervals.
### Components/Axes
* **Title:** 10x10 Maze: Grid Ablation
* **X-axis:**
* **Label:** Training Examples
* **Scale:** 0, 30, 60, 90, 120, 150, 180, 210, 240
* **Y-axis:**
* **Label:** Success Rate (%)
* **Scale:** 0, 10, 20, 30, 40, 50
* **Legend:** Located at the bottom of the chart.
* Best Baseline (With Grid) - solid blue line
* Best Baseline (No Grid) - solid orange line
* L-ICL (With Grid) - blue line with circular markers
* L-ICL (No Grid) - orange line with circular markers
### Detailed Analysis
* **Best Baseline (With Grid):** (solid blue line)
* This line is nearly flat, hovering around a success rate of approximately 4%.
* Training Examples: 0, Success Rate: ~4%
* Training Examples: 240, Success Rate: ~4%
* **Best Baseline (No Grid):** (solid orange line)
* This line is also nearly flat, hovering around a success rate of approximately 2%.
* Training Examples: 0, Success Rate: ~2%
* Training Examples: 240, Success Rate: ~2%
* **L-ICL (With Grid):** (blue line with circular markers)
* The line starts at approximately 16% and generally increases, peaking around 150 training examples, then slightly decreasing and stabilizing.
* Training Examples: 0, Success Rate: ~16%
* Training Examples: 30, Success Rate: ~19%
* Training Examples: 60, Success Rate: ~21%
* Training Examples: 90, Success Rate: ~18%
* Training Examples: 120, Success Rate: ~22%
* Training Examples: 150, Success Rate: ~42%
* Training Examples: 180, Success Rate: ~39%
* Training Examples: 210, Success Rate: ~38%
* Training Examples: 240, Success Rate: ~39%
* **L-ICL (No Grid):** (orange line with circular markers)
* The line starts low, increases sharply until 120 training examples, then decreases slightly before increasing again and stabilizing.
* Training Examples: 0, Success Rate: ~6%
* Training Examples: 30, Success Rate: ~14%
* Training Examples: 60, Success Rate: ~27%
* Training Examples: 90, Success Rate: ~32%
* Training Examples: 120, Success Rate: ~37%
* Training Examples: 150, Success Rate: ~30%
* Training Examples: 180, Success Rate: ~31%
* Training Examples: 210, Success Rate: ~36%
* Training Examples: 240, Success Rate: ~34%
### Key Observations
* The "Best Baseline" models (both with and without grid) perform significantly worse than the "L-ICL" models.
* The "L-ICL (With Grid)" model shows a higher peak success rate compared to the "L-ICL (No Grid)" model.
* Both "L-ICL" models show a general increasing trend in success rate as the number of training examples increases, although there are fluctuations.
* The shaded regions around the "L-ICL" lines indicate variability in performance, which is more pronounced at certain training example counts.
### Interpretation
The chart suggests that using L-ICL significantly improves the success rate in the 10x10 Maze task compared to the "Best Baseline" models. The presence of a grid further enhances the performance of the L-ICL model, especially around 150 training examples. The variability indicated by the shaded regions suggests that the performance of the L-ICL models can fluctuate, possibly due to the stochastic nature of the training process or the complexity of the maze environment. The flat lines of the "Best Baseline" models indicate that they are not learning effectively from the training examples.