## Trajectory Plot: Figure-Eight Movement
### Overview
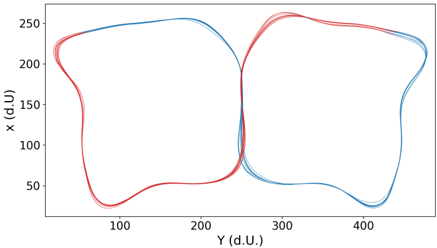
The image is a trajectory plot showing movement patterns in a figure-eight shape. The plot displays the x-coordinate versus the y-coordinate, both in arbitrary units (d.U.). There are two distinct trajectories, one in red and one in blue, each forming a loop of the figure eight. Multiple lines of each color suggest multiple trials or repetitions of the movement.
### Components/Axes
* **X-axis:** Labeled "Y (d.U.)", ranging from approximately 50 to 450.
* **Y-axis:** Labeled "x (d.U)", ranging from 0 to 250.
* **Data Series:** Two data series are plotted: one in red and one in blue. Each series consists of multiple overlapping lines, indicating multiple trials.
### Detailed Analysis
* **Red Trajectory:**
* Starts at approximately (Y=50, x=20).
* Moves upwards and to the right, reaching a peak of approximately (Y=150, x=240).
* Then moves downwards and to the right, reaching a minimum of approximately (Y=200, x=190).
* Then moves downwards and to the left, reaching a minimum of approximately (Y=100, x=10).
* Finally, moves upwards and to the right, returning to the starting point.
* **Blue Trajectory:**
* Starts at approximately (Y=250, x=200).
* Moves upwards and to the right, reaching a peak of approximately (Y=350, x=250).
* Then moves downwards and to the right, reaching a minimum of approximately (Y=420, x=230).
* Then moves downwards and to the left, reaching a minimum of approximately (Y=350, x=10).
* Finally, moves upwards and to the left, returning to the starting point.
### Key Observations
* The trajectories form a figure-eight pattern.
* The red trajectory is located on the left side of the figure eight, while the blue trajectory is on the right side.
* There is some variability in the trajectories, as indicated by the multiple overlapping lines.
* The two trajectories intersect at approximately (Y=250, x=200).
### Interpretation
The plot likely represents the movement of a subject performing a figure-eight task. The red and blue trajectories could represent different conditions, subjects, or trials. The variability in the trajectories suggests that the movement is not perfectly consistent. The intersection point represents the point where the subject transitions from one loop of the figure eight to the other. The data suggests that the subject is able to perform the figure-eight task, but there is some variability in their performance. Further analysis could be performed to quantify the variability and to compare the performance under different conditions.