\n
## Chart: X vs Y Scatter Plot with Two Series
### Overview
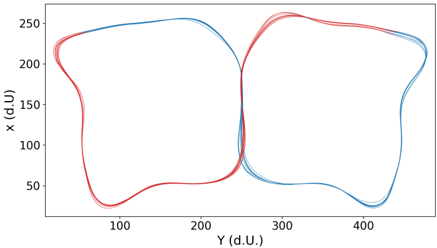
The image presents a scatter plot displaying two distinct series of data, represented by red and blue lines. The plot visualizes the relationship between two variables, 'X (d.U.)' and 'Y (d.U.)'. The data appears to trace closed loops, suggesting cyclical or periodic behavior.
### Components/Axes
* **X-axis:** Labeled "Y (d.U.)", ranging from approximately 50 to 450.
* **Y-axis:** Labeled "X (d.U.)", ranging from approximately 50 to 250.
* **Data Series 1:** Red lines, forming a closed loop.
* **Data Series 2:** Blue lines, also forming a closed loop.
* **No Legend:** There is no explicit legend provided in the image.
### Detailed Analysis
**Red Data Series:**
The red line begins at approximately (100, 250), decreases to a minimum of around (100, 50), then increases to approximately (300, 250), and finally returns to the starting point, completing a loop. The shape is roughly elliptical, but with significant distortion.
* Approximate Data Points (Red):
* (100, 250)
* (100, 50)
* (300, 50)
* (300, 250)
**Blue Data Series:**
The blue line starts at approximately (200, 250), decreases to a minimum of around (200, 50), then increases to approximately (400, 250), and finally returns to the starting point, completing a loop. Similar to the red line, it's an elliptical shape with distortion.
* Approximate Data Points (Blue):
* (200, 250)
* (200, 50)
* (400, 50)
* (400, 250)
Both series exhibit multiple lines, indicating either multiple trials or variations within the data. The lines are closely grouped, suggesting relatively consistent behavior within each series.
### Key Observations
* The two series exhibit distinct loop shapes, offset from each other along the Y-axis.
* Both series show a similar overall pattern of decreasing and increasing values for both X and Y.
* The loops are not perfectly symmetrical, indicating non-linear relationships.
* The data points are densely packed within each loop, suggesting a high sampling rate or a smooth, continuous process.
### Interpretation
The chart likely represents a cyclical process or a system exhibiting periodic behavior. The two series could represent different conditions, treatments, or measurements of the same system. The offset between the loops suggests a phase shift or a difference in the starting point of the cycles. The 'd.U.' unit is unknown, but it is consistent across both axes.
The shape of the loops suggests that the relationship between X and Y is not linear. The distortion of the loops could be due to external factors, measurement errors, or inherent complexities in the system being studied. The multiple lines within each series suggest that the process is not perfectly repeatable, but exhibits some degree of variability.
Without further context, it's difficult to determine the specific meaning of the data. However, the chart provides valuable insights into the cyclical nature of the system and the differences between the two series. Further investigation would be needed to understand the underlying mechanisms driving these patterns.