## Line Graph: Intersecting Loops of Line A and Line B
### Overview
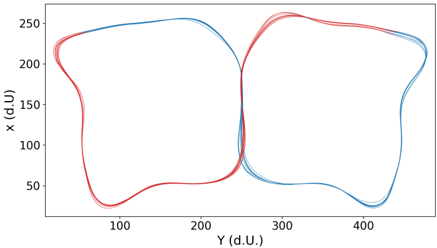
The image depicts a line graph with two distinct loops (red and blue) plotted on a coordinate plane. The red line (Line A) and blue line (Line B) form closed loops that intersect near the center of the graph. The axes are labeled with "X (d.U.)" and "Y (d.U.)", suggesting a coordinate system with units denoted as "d.U." (possibly a domain-specific unit).
### Components/Axes
- **X-axis**: Labeled "Y (d.U.)", ranging approximately from 50 to 400.
- **Y-axis**: Labeled "X (d.U.)", ranging approximately from 50 to 250.
- **Legend**: Located in the top-right corner, with:
- **Red**: "Line A"
- **Blue**: "Line B"
### Detailed Analysis
- **Line A (Red)**:
- Starts at the bottom-left corner (X ≈ 50, Y ≈ 100).
- Rises to the top-left (X ≈ 250, Y ≈ 250).
- Moves right to the top-right (X ≈ 400, Y ≈ 250).
- Descends to the bottom-right (X ≈ 400, Y ≈ 50).
- Returns to the starting point, forming a loop.
- **Line B (Blue)**:
- Starts at the bottom-right corner (X ≈ 400, Y ≈ 50).
- Rises to the top-right (X ≈ 400, Y ≈ 250).
- Moves left to the top-left (X ≈ 250, Y ≈ 250).
- Descends to the bottom-left (X ≈ 50, Y ≈ 100).
- Returns to the starting point, forming a loop.
- **Intersection**: The two lines intersect near the center of the graph at approximately (X ≈ 250, Y ≈ 200).
### Key Observations
1. **Symmetry**: The loops are roughly symmetrical but not perfectly aligned.
2. **Intersection Point**: The crossing of Line A and Line B suggests a shared reference or equilibrium point.
3. **Axis Labeling**: The X-axis is labeled "Y (d.U.)" and the Y-axis "X (d.U.)", which may indicate a non-standard coordinate system or a potential labeling error.
4. **Unit Ambiguity**: The unit "d.U." is undefined in the image, requiring further context for interpretation.
### Interpretation
The graph likely represents two cyclical processes or variables (Line A and Line B) that interact at a central point. The loops could symbolize recurring patterns, feedback mechanisms, or interdependent systems. The intersection at (250, 200) may indicate a critical threshold or equilibrium state where the two processes converge. The axis labeling discrepancy ("X" vs. "Y") raises questions about the coordinate system's orientation, which could affect the interpretation of the data. Without additional context, the exact meaning of "d.U." remains unclear, but the visual structure emphasizes the relationship between the two lines.