## Line Chart: R1-Llama | AMC23
### Overview
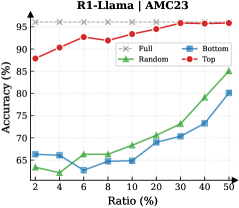
The image is a line chart comparing the accuracy of different methods ("Full", "Random", "Bottom", "Top") across varying ratios. The chart displays accuracy (in percentage) on the y-axis and ratio (in percentage) on the x-axis.
### Components/Axes
* **Title:** R1-Llama | AMC23
* **X-axis:** Ratio (%) with markers at 2, 4, 6, 8, 10, 20, 30, 40, 50
* **Y-axis:** Accuracy (%) with markers at 65, 70, 75, 80, 85, 90, 95
* **Legend:** Located in the top-center of the chart.
* Full (Gray dashed line with 'x' markers)
* Random (Green line with triangle markers)
* Bottom (Blue line with square markers)
* Top (Red line with circle markers)
### Detailed Analysis
* **Full (Gray dashed line with 'x' markers):** The accuracy remains relatively constant at approximately 96% across all ratios.
* Ratio 2%: ~96%
* Ratio 50%: ~96%
* **Random (Green line with triangle markers):** The accuracy generally increases with the ratio.
* Ratio 2%: ~63%
* Ratio 6%: ~63%
* Ratio 10%: ~68%
* Ratio 20%: ~70%
* Ratio 30%: ~75%
* Ratio 50%: ~85%
* **Bottom (Blue line with square markers):** The accuracy generally increases with the ratio, with some fluctuations.
* Ratio 2%: ~66%
* Ratio 6%: ~63%
* Ratio 10%: ~65%
* Ratio 20%: ~70%
* Ratio 30%: ~73%
* Ratio 50%: ~80%
* **Top (Red line with circle markers):** The accuracy starts high and remains relatively high, with some fluctuations.
* Ratio 2%: ~88%
* Ratio 6%: ~93%
* Ratio 10%: ~92%
* Ratio 20%: ~93%
* Ratio 30%: ~95%
* Ratio 50%: ~96%
### Key Observations
* The "Full" method consistently achieves the highest accuracy across all ratios.
* The "Random" method shows the most significant improvement in accuracy as the ratio increases.
* The "Top" method starts with high accuracy and maintains it across different ratios.
* The "Bottom" method shows a gradual increase in accuracy as the ratio increases.
### Interpretation
The chart compares the performance of different methods (Full, Random, Bottom, Top) in terms of accuracy at various ratios. The "Full" method, represented by the gray dashed line, consistently achieves the highest accuracy, suggesting it is the most reliable approach across different ratios. The "Random" method, represented by the green line, shows a notable improvement in accuracy as the ratio increases, indicating that its performance is more sensitive to the ratio. The "Top" method, represented by the red line, starts with high accuracy and maintains it across different ratios, suggesting it is a robust approach. The "Bottom" method, represented by the blue line, shows a gradual increase in accuracy as the ratio increases, indicating that its performance is also influenced by the ratio. Overall, the chart provides insights into the effectiveness of different methods at various ratios, with the "Full" method being the most consistent and accurate.