## Line Chart: Compute-matched analysis: GPQA-Physics
### Overview
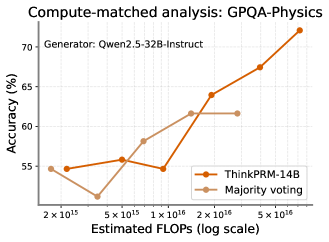
The image is a line chart comparing the performance (accuracy) of two methods, "ThinkPRM-14B" and "Majority voting," as a function of increasing computational resources (estimated FLOPs). The analysis is performed on the GPQA-Physics benchmark using the Qwen2.5-32B-Instruct model as the generator.
### Components/Axes
* **Chart Title:** "Compute-matched analysis: GPQA-Physics"
* **Subtitle/Generator Label:** "Generator: Qwen2.5-32B-Instruct"
* **Y-Axis:**
* **Label:** "Accuracy (%)"
* **Scale:** Linear, ranging from 55 to 70, with major tick marks at 55, 60, 65, and 70.
* **X-Axis:**
* **Label:** "Estimated FLOPs (log₁₀ scale)"
* **Scale:** Logarithmic (base 10). Major tick marks are labeled: `2 x 10¹⁵`, `5 x 10¹⁵`, `1 x 10¹⁶`, `2 x 10¹⁶`, `5 x 10¹⁶`.
* **Legend:** Located in the bottom-right quadrant of the chart area.
* **Orange line with circle markers:** "ThinkPRM-14B"
* **Light brown/tan line with circle markers:** "Majority voting"
### Detailed Analysis
**Data Series 1: ThinkPRM-14B (Orange Line)**
* **Trend:** The line shows a relatively flat or slightly increasing trend at lower compute levels, followed by a steep, consistent upward slope at higher compute levels.
* **Data Points (Approximate):**
* At ~2 x 10¹⁵ FLOPs: Accuracy ≈ 55%
* At ~5 x 10¹⁵ FLOPs: Accuracy ≈ 55.5%
* At ~1 x 10¹⁶ FLOPs: Accuracy ≈ 55%
* At ~2 x 10¹⁶ FLOPs: Accuracy ≈ 64%
* At ~5 x 10¹⁶ FLOPs: Accuracy ≈ 68%
* At the final point (estimated >5 x 10¹⁶ FLOPs): Accuracy ≈ 72%
**Data Series 2: Majority voting (Light Brown Line)**
* **Trend:** The line shows an initial dip, followed by a steady, moderate upward trend that appears to plateau at the highest compute levels shown.
* **Data Points (Approximate):**
* At ~2 x 10¹⁵ FLOPs: Accuracy ≈ 55%
* At ~5 x 10¹⁵ FLOPs: Accuracy ≈ 52% (This is a notable dip)
* At ~1 x 10¹⁶ FLOPs: Accuracy ≈ 58%
* At ~2 x 10¹⁶ FLOPs: Accuracy ≈ 61.5%
* At ~5 x 10¹⁶ FLOPs: Accuracy ≈ 61.5% (Plateau)
### Key Observations
1. **Crossover Point:** The two methods have similar accuracy at the lowest compute point (~2 x 10¹⁵ FLOPs). ThinkPRM-14B dips below Majority voting at ~5 x 10¹⁵ FLOPs but then surpasses it decisively at ~1 x 10¹⁶ FLOPs and maintains a significant lead thereafter.
2. **Scaling Behavior:** ThinkPRM-14B demonstrates superior scaling with increased compute. Its accuracy continues to climb steeply across the entire range, especially after 1 x 10¹⁶ FLOPs. Majority voting shows more modest gains and appears to saturate.
3. **Anomaly:** The Majority voting series shows a distinct performance drop at ~5 x 10¹⁵ FLOPs before recovering. This could indicate a specific compute regime where the voting mechanism is less effective or a potential measurement outlier.
### Interpretation
This chart illustrates a **compute-performance scaling law comparison** for two reasoning or inference techniques on a physics QA task. The key finding is that the "ThinkPRM-14B" method (likely a process reward model or a specific reasoning framework) is significantly more **compute-efficient at higher scales** than the simpler "Majority voting" baseline.
* **What it suggests:** Investing more computational resources (FLOPs) yields substantially greater accuracy improvements when using ThinkPRM-14B compared to majority voting. The diverging trends imply that for large-scale, high-performance applications, advanced methods like ThinkPRM are necessary to fully leverage available compute.
* **Relationship between elements:** The x-axis (compute) is the independent variable being increased. The y-axis (accuracy) is the dependent outcome. The two lines represent different algorithms attempting to convert the same "budget" of compute into performance. The widening gap between the lines visually quantifies the growing advantage of the more sophisticated method.
* **Notable patterns:** The plateau in Majority voting suggests it hits a performance ceiling, while ThinkPRM-14B shows no such saturation within the tested range, hinting at a higher potential ceiling. The initial dip for Majority voting is curious and might warrant investigation into the stability of that method at specific compute points.