## Diagram: U-Net Architecture
### Overview
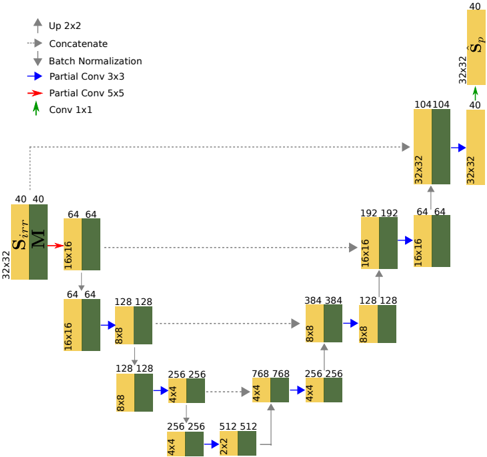
The image depicts a U-Net architecture diagram, a type of convolutional neural network often used for image segmentation. The diagram illustrates the flow of data through various layers, including convolutional layers, batch normalization, and upsampling operations. The architecture has a symmetrical U-shape, with a contracting (encoder) path on the left and an expanding (decoder) path on the right.
### Components/Axes
* **Legend (Top-Left)**:
* Up 2x2: Gray arrow pointing upwards.
* Concatenate: Gray arrow pointing to the right.
* Batch Normalization: Blue arrow pointing to the right.
* Partial Conv 3x3: Blue arrow pointing to the right.
* Partial Conv 5x5: Red arrow pointing upwards.
* Conv 1x1: Green arrow pointing upwards.
* **Blocks**: Each block represents a layer or a series of layers. The blocks are colored either yellow or dark green. The dimensions of the feature maps are indicated above and below each block (e.g., 32x32, 16x16, 8x8, 4x4, 2x2).
* **Labels**:
* S<sub>irr</sub>: Located on the left side of the diagram, near the top.
* M: Located next to S<sub>irr</sub>.
* S<sub>p</sub>: Located on the right side of the diagram, near the top.
### Detailed Analysis
**Encoder (Contracting Path - Left Side)**:
1. **Input Block**:
* Dimensions: 32x32
* Values: 40 (top), 40 (top), S<sub>irr</sub>, M
2. **First Downsampling Block**:
* Dimensions: 16x16
* Values: 64 (top), 64 (top)
* Connection: Red arrow (Partial Conv 5x5) from the input block.
3. **Second Downsampling Block**:
* Dimensions: 8x8
* Values: 128 (top), 128 (top)
* Connection: Blue arrow (Partial Conv 3x3) from the first downsampling block.
4. **Third Downsampling Block**:
* Dimensions: 4x4
* Values: 256 (top), 256 (top)
* Connection: Blue arrow (Partial Conv 3x3) from the second downsampling block.
5. **Bottom Block**:
* Dimensions: 2x2
* Values: 512 (top), 512 (top)
* Connection: Blue arrow (Partial Conv 3x3) from the third downsampling block.
**Decoder (Expanding Path - Right Side)**:
1. **First Upsampling Block**:
* Dimensions: 4x4
* Values: 768 (top), 768 (top)
* Connection: Gray arrow (Concatenate) from the bottom block.
2. **Second Upsampling Block**:
* Dimensions: 8x8
* Values: 384 (top), 384 (top)
* Connection: Gray arrow (Concatenate) from the first upsampling block.
3. **Third Upsampling Block**:
* Dimensions: 16x16
* Values: 192 (top), 192 (top)
* Connection: Blue arrow (Batch Normalization) from the second upsampling block, and a gray arrow (Concatenate) from the second downsampling block.
4. **Fourth Upsampling Block**:
* Dimensions: 32x32
* Values: 104 (top), 104 (top)
* Connection: Blue arrow (Batch Normalization) from the third upsampling block, and a gray arrow (Concatenate) from the first downsampling block.
5. **Output Block**:
* Dimensions: 32x32
* Values: 40 (top), 40 (top), S<sub>p</sub>
* Connection: Green arrow (Conv 1x1) from the fourth upsampling block.
**Skip Connections**:
* Gray dotted lines represent skip connections that concatenate feature maps from the encoder path to the decoder path. These connections help to preserve fine-grained details and improve the accuracy of the segmentation.
### Key Observations
* The U-Net architecture is symmetrical, with a contracting path and an expanding path.
* Skip connections are used to concatenate feature maps from the encoder path to the decoder path.
* The dimensions of the feature maps decrease in the encoder path and increase in the decoder path.
* The diagram illustrates the flow of data through various layers, including convolutional layers, batch normalization, and upsampling operations.
### Interpretation
The U-Net architecture is designed for image segmentation tasks. The contracting path captures the context of the image, while the expanding path enables precise localization. The skip connections help to preserve fine-grained details and improve the accuracy of the segmentation. The diagram provides a visual representation of the architecture and the flow of data through the network. The use of different colored arrows indicates different operations, such as batch normalization, partial convolutions, and upsampling. The dimensions of the feature maps at each layer are also indicated, providing a detailed view of the network's structure.