## Diagram: U-Net Architecture Block
### Overview
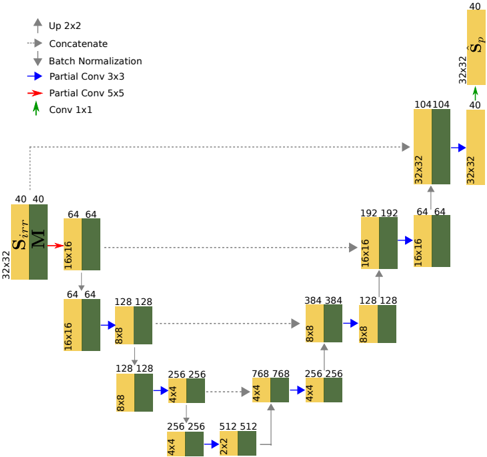
This diagram depicts a block of a U-Net architecture, a common convolutional neural network used for image segmentation. The diagram illustrates the flow of data through a series of convolutional and upsampling layers, showing the changes in feature map size and channel depth. The diagram is oriented vertically, with input on the left and output on the right.
### Components/Axes
The diagram uses several visual cues to represent different operations:
* **Arrows:** Indicate the direction of data flow. Different arrow styles represent different operations (Up 2x2, Concatenate, Batch Normalization, Partial Conv 3x3, Partial Conv 5x5, Conv 1x1).
* **Rectangles:** Represent feature maps, with dimensions (height x width) and channel depth indicated within the rectangle. Colors differentiate input (green) and output (yellow).
* **Labels:** Text labels identify the operations and feature maps.
* **S<sub>irr</sub><sup>T</sup>:** Represents the input feature map.
* **S<sub>p</sub>:** Represents the output feature map.
* **M:** Indicates the Mask.
### Detailed Analysis
The diagram shows a series of operations starting from a 32x32x64 input feature map (S<sub>irr</sub><sup>T</sup>).
1. **Initial Block:** A 32x32x64 feature map (green) is the input.
2. **Downsampling Path:**
* A 16x16x128 feature map (green) is produced.
* A 8x8x256 feature map (yellow) is produced.
* A 4x4x512 feature map (green) is produced.
* A 2x2x512 feature map (green) is produced.
3. **Upsampling Path:**
* A 4x4x256 feature map (yellow) is produced.
* A 8x8x128 feature map (yellow) is produced.
* A 16x16x64 feature map (yellow) is produced.
4. **Concatenation and Final Output:**
* A 32x32x104 feature map (yellow) is produced.
* A 32x32x40 feature map (green) is produced.
The operations between these feature maps are as follows:
* From 32x32x64 to 16x16x128: Partial Conv 3x3
* From 16x16x128 to 8x8x256: Partial Conv 3x3
* From 8x8x256 to 4x4x512: Partial Conv 3x3
* From 4x4x512 to 2x2x512: Partial Conv 3x3
* From 2x2x512 to 4x4x256: Up 2x2
* From 4x4x256 to 8x8x128: Up 2x2
* From 8x8x128 to 16x16x64: Up 2x2
* From 16x16x64 to 32x32x104: Up 2x2
* From 32x32x104 to 32x32x40: Conv 1x1
The diagram also shows concatenation operations between the upsampled feature maps and the corresponding feature maps from the downsampling path.
### Key Observations
* The diagram illustrates a symmetrical structure, characteristic of U-Net architectures.
* The channel depth increases as the spatial resolution decreases in the downsampling path and decreases as the spatial resolution increases in the upsampling path.
* The use of "Partial Conv" suggests a specific type of convolutional layer that handles irregular shapes or missing data.
* The final Conv 1x1 layer reduces the channel depth from 104 to 40.
### Interpretation
This diagram represents a key building block of a U-Net architecture, commonly used for image segmentation tasks. The U-Net's architecture is designed to capture both local and global context by combining a contracting path (downsampling) to extract features and an expanding path (upsampling) to reconstruct the segmentation map. The skip connections (concatenation) between the downsampling and upsampling paths help to preserve fine-grained details that might be lost during the downsampling process. The use of partial convolutions suggests that the network is designed to handle images with irregular boundaries or missing data. The diagram provides a clear visual representation of the data flow and the transformations applied at each layer, aiding in understanding the network's functionality. The overall structure suggests a focus on preserving spatial information while extracting high-level features for accurate segmentation.