## Line Chart: Pass@k (%) Performance Across Training Methods
### Overview
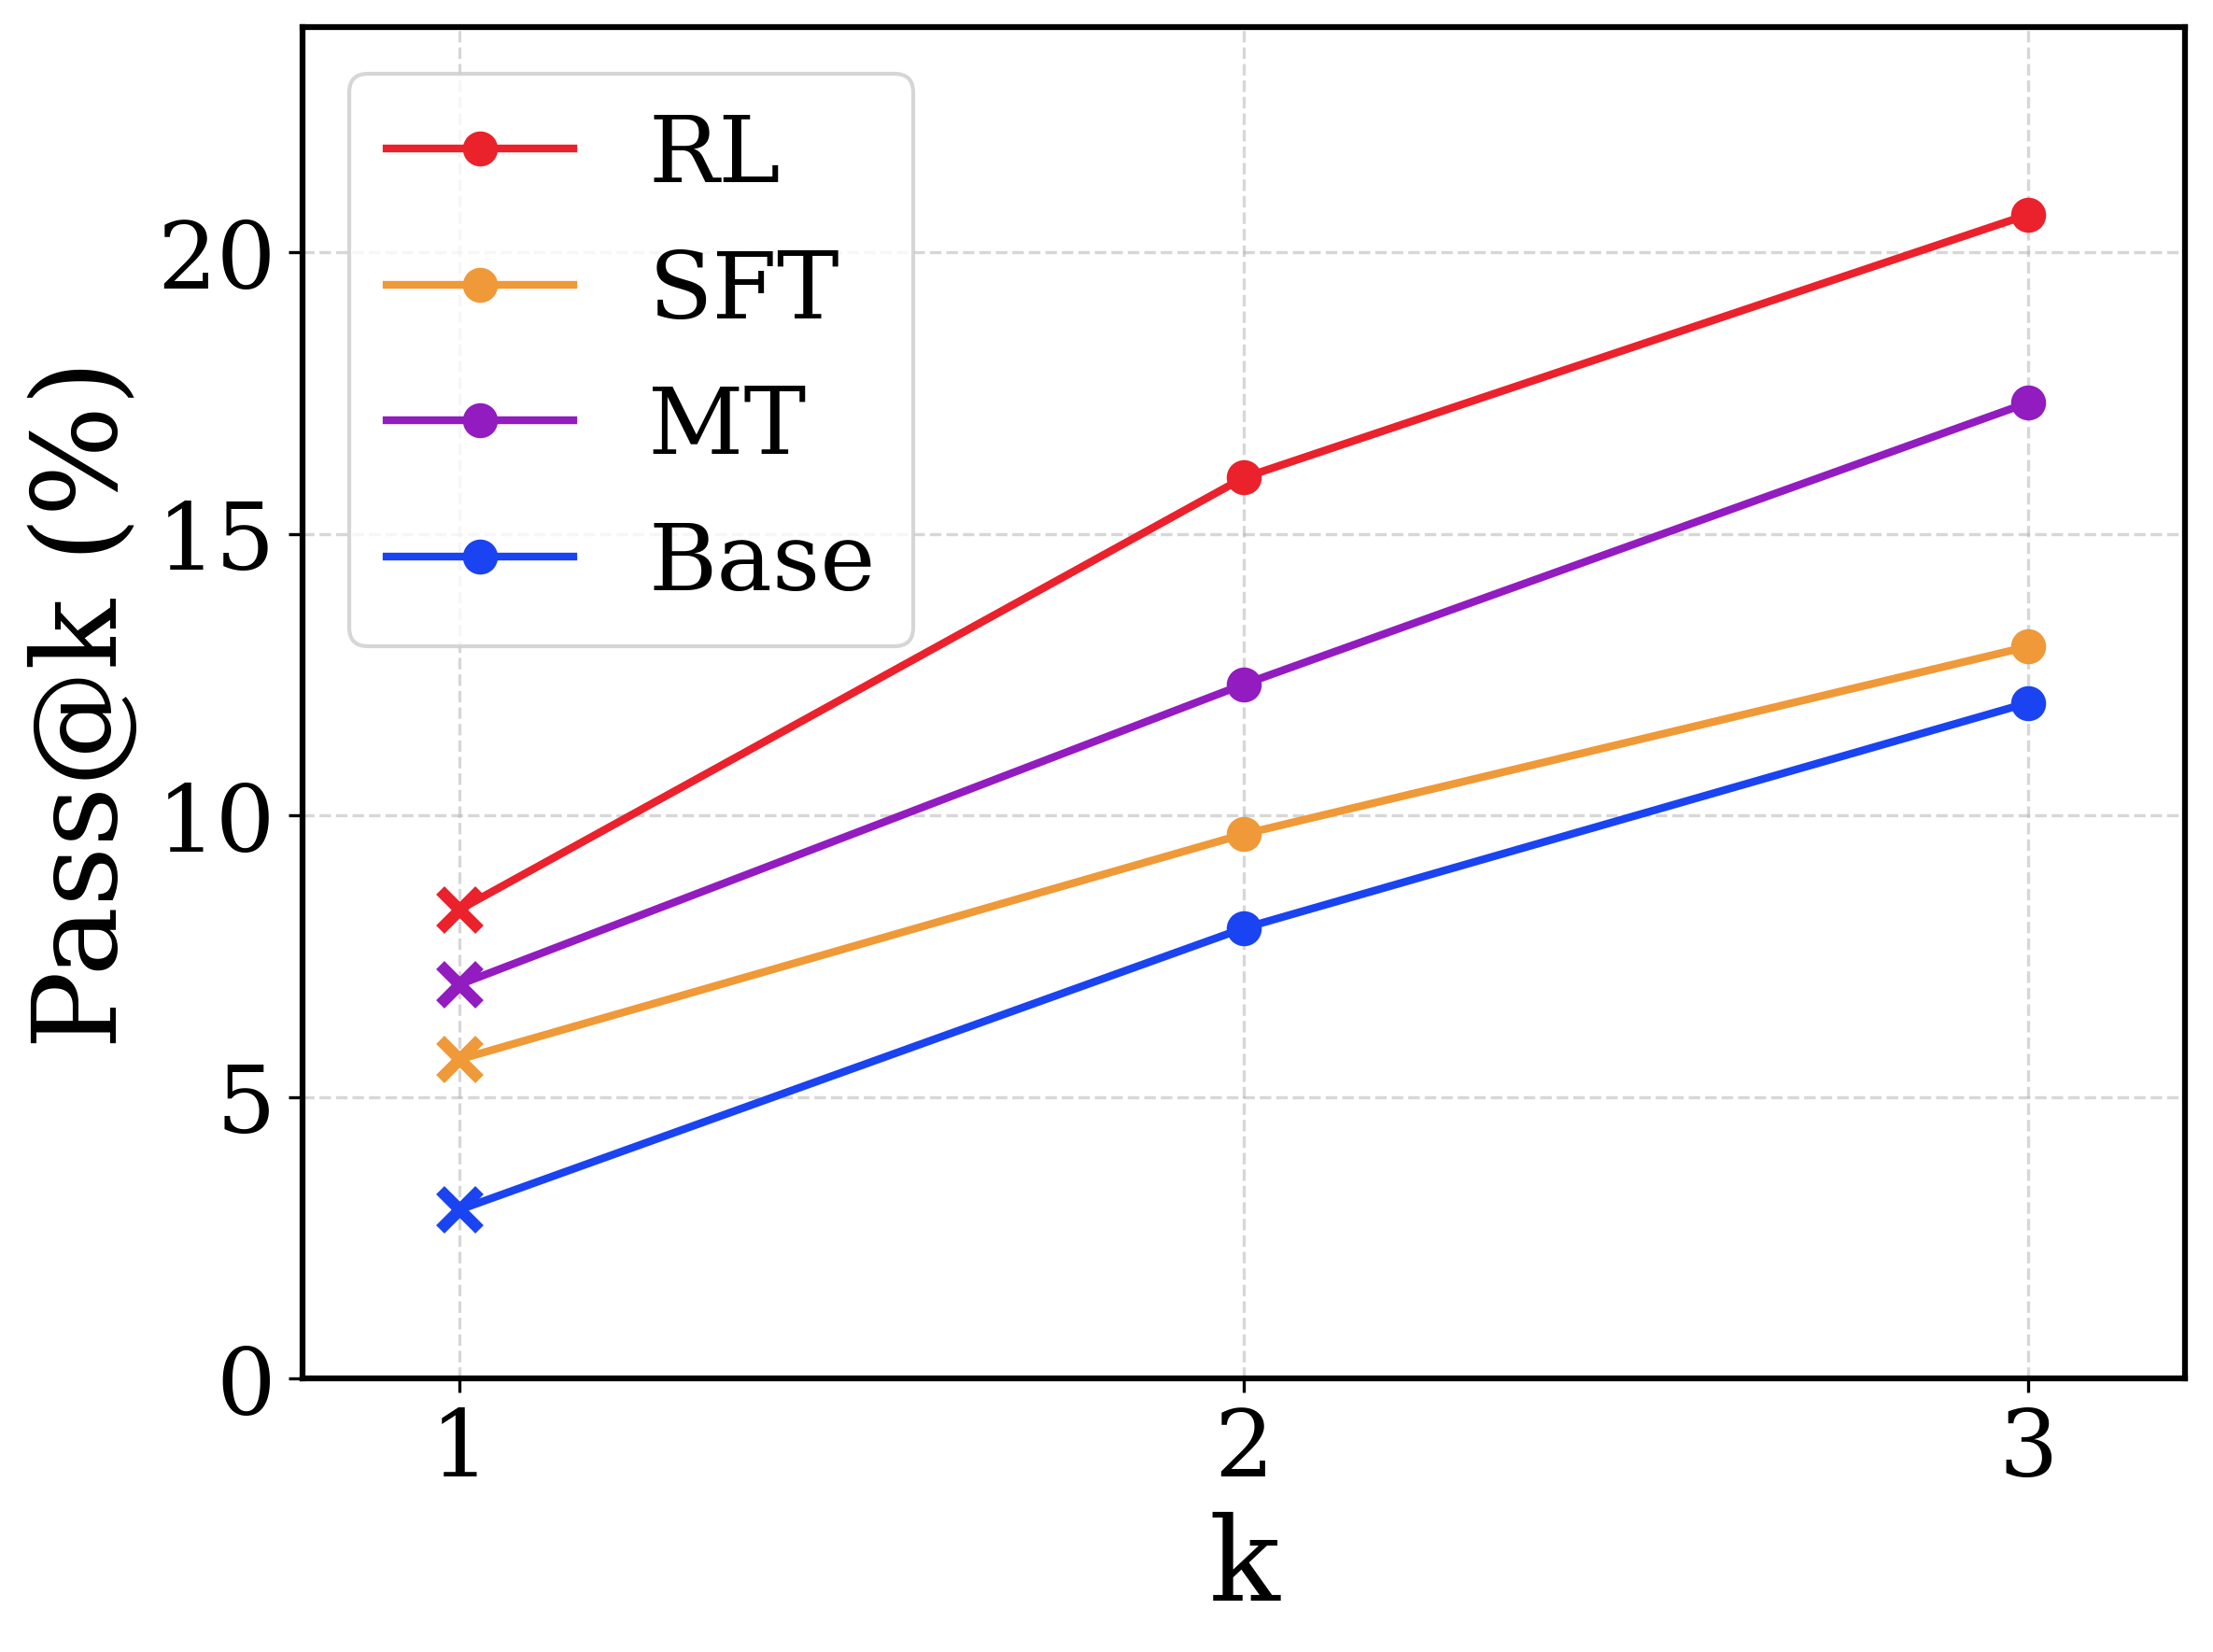
This image is a line chart comparing the performance of four different machine learning models or training methodologies across a metric denoted as "Pass@k (%)". The x-axis represents the value of 'k' (1, 2, and 3), and the y-axis represents the percentage score.
### Components/Axes
The image can be isolated into the following distinct components:
* **Y-axis (Left):**
* **Label:** "Pass@k (%)" (Text is rotated 90 degrees counter-clockwise).
* **Scale:** Ranges from 0 to roughly 25, with visible tick marks and corresponding horizontal dashed grid lines at 0, 5, 10, 15, and 20.
* **X-axis (Bottom):**
* **Label:** "k".
* **Scale:** Discrete categorical/numerical markers at 1, 2, and 3. Vertical dashed grid lines align with these markers.
* **Legend (Top-Left):** A bounding box containing four entries, mapping line colors to model names.
* Red line with a circular marker: "RL"
* Orange line with a circular marker: "SFT"
* Purple line with a circular marker: "MT"
* Blue line with a circular marker: "Base"
* **Main Chart Area:** Contains four distinct lines plotting data points across the x-axis grid lines. Notably, the data points at k=1 are marked with an 'x' symbol, while the data points at k=2 and k=3 are marked with solid circles.
### Detailed Analysis
**Trend Verification:**
Before extracting specific values, a visual inspection of the trends reveals that all four lines slope upward from left to right. This indicates a positive correlation for all models: as 'k' increases, the 'Pass@k (%)' score increases. Furthermore, the lines never intersect; they maintain a strict vertical hierarchy across all values of 'k'.
**Data Extraction (Approximate Values):**
*Cross-referencing the legend colors with the lines from top to bottom:*
1. **RL (Red Line - Top-most position):**
* *Trend:* Slopes upward steeply, showing the highest rate of growth.
* k=1 (marked with 'x'): ~8.3%
* k=2 (marked with circle): ~16.0%
* k=3 (marked with circle): ~20.8%
2. **MT (Purple Line - Second from top):**
* *Trend:* Slopes upward steadily, maintaining a consistent gap below the RL line.
* k=1 (marked with 'x'): ~7.0%
* k=2 (marked with circle): ~12.4%
* k=3 (marked with circle): ~17.4%
3. **SFT (Orange Line - Third from top):**
* *Trend:* Slopes upward, but at a slightly shallower angle than RL and MT.
* k=1 (marked with 'x'): ~5.7%
* k=2 (marked with circle): ~9.7%
* k=3 (marked with circle): ~13.0%
4. **Base (Blue Line - Bottom-most position):**
* *Trend:* Slopes upward, maintaining a relatively parallel trajectory to the SFT line.
* k=1 (marked with 'x'): ~3.0%
* k=2 (marked with circle): ~8.0%
* k=3 (marked with circle): ~12.0%
### Key Observations
* **Strict Hierarchy:** The performance ranking is absolute across all measured points: RL > MT > SFT > Base.
* **Divergence:** The performance gap between the best method (RL) and the worst method (Base) widens as 'k' increases. At k=1, the gap is roughly 5.3 percentage points. At k=3, the gap expands to roughly 8.8 percentage points.
* **Marker Anomaly:** The legend shows only circular markers for all lines. However, on the chart itself, the data points at k=1 are plotted using 'x' markers, while k=2 and k=3 use circles.
### Interpretation
This chart is highly characteristic of evaluation metrics used in generative Artificial Intelligence, specifically Large Language Models (LLMs) evaluated on coding or reasoning tasks (like the HumanEval benchmark).
* **The Metric:** "Pass@k" measures the probability that at least one out of 'k' generated responses is correct. Naturally, as a model is allowed more attempts (higher 'k'), the probability of getting at least one correct answer increases, which explains the universal upward trend.
* **The Models (Reading between the lines):** The labels represent standard stages in modern AI model training pipelines:
* **Base:** The foundational, pre-trained model (lowest performance).
* **SFT:** Supervised Fine-Tuning. Training the base model on high-quality instruction-response pairs yields a noticeable improvement.
* **MT:** Likely stands for Multi-Task training (or potentially a specific intermediate tuning phase), showing further improvement over standard SFT.
* **RL:** Reinforcement Learning (often RLHF - Reinforcement Learning from Human Feedback or RLAIF). This technique yields the highest performance.
* **Significance:** The data demonstrates the compounding value of advanced alignment techniques. Not only does RL have the highest baseline accuracy (Pass@1), but its steeper slope indicates it benefits more from multiple sampling attempts (Pass@2, Pass@3) than the Base or SFT models. This suggests the RL model generates a higher diversity of viable, correct answers when sampled multiple times.
* **The 'x' Marker:** The distinct 'x' marker at k=1 likely denotes a methodological difference in how the data was gathered. Pass@1 is often evaluated using "greedy decoding" (temperature = 0, picking the single most likely token), whereas Pass@k (where k > 1) requires sampling with a higher temperature to generate diverse responses. The change in marker shape visually separates the deterministic evaluation (k=1) from the probabilistic sampling evaluations (k=2, 3).