\n
## Diagram: Effects of Mutations
### Overview
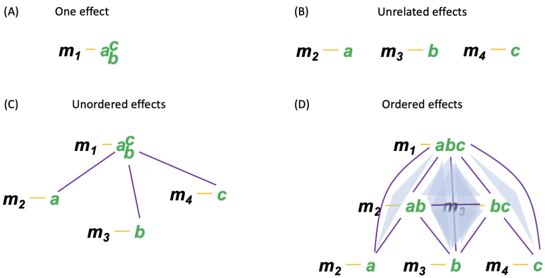
The image presents four diagrams (A, B, C, and D) illustrating different effects of mutations (labeled m1, m2, m3, m4) on phenotypes (labeled a, b, c). Each diagram represents a different relationship between mutations and their resulting effects. The diagrams are arranged in a 2x2 grid.
### Components/Axes
Each diagram consists of mutation nodes (m1, m2, m3, m4) and effect nodes (a, b, c). Lines connect the mutation nodes to the effect nodes, indicating the relationship between them. Each diagram has a title indicating the type of effect being illustrated: "One effect", "Unrelated effects", "Unordered effects", and "Ordered effects".
### Detailed Analysis or Content Details
**Diagram A: One effect**
* Mutation m1 is connected to effects a and b.
* The connection is represented by a single line branching into two.
**Diagram B: Unrelated effects**
* Mutation m2 is connected to effect a.
* Mutation m3 is connected to effect b.
* Mutation m4 is connected to effect c.
* Each mutation has a direct, independent connection to its respective effect.
**Diagram C: Unordered effects**
* Mutation m1 is connected to effects a and b.
* Mutation m2 is connected to effect a.
* Mutation m3 is connected to effect b.
* Mutation m4 is connected to effect c.
* The connections form a tree-like structure with m1 as the root.
**Diagram D: Ordered effects**
* Mutation m1 is connected to effects a, b, and c.
* Mutation m2 is connected to effects a and b.
* Mutation m3 is connected to effects b and c.
* Mutation m4 is connected to effect c.
* The connections form overlapping arcs, indicating an ordered relationship between mutations and effects. The overlapping regions represent combined effects (ab, bc).
### Key Observations
* Diagram A shows a single mutation causing multiple effects.
* Diagram B shows multiple mutations each causing a single, unrelated effect.
* Diagram C shows a hierarchical relationship where one mutation influences multiple effects, and other mutations contribute to those same effects.
* Diagram D shows an ordered relationship where mutations build upon each other to create combined effects.
### Interpretation
The diagrams illustrate different models of how mutations can influence phenotypes. Diagram A represents pleiotropy, where a single gene affects multiple traits. Diagram B represents a simple additive model, where each mutation contributes independently to a trait. Diagram C represents a more complex model where mutations can interact in a hierarchical manner. Diagram D represents epistasis, where the effect of one mutation depends on the presence of other mutations. The diagrams are useful for understanding the genetic basis of complex traits and for predicting the effects of mutations. The diagrams do not contain numerical data, but rather conceptual relationships. They are meant to be illustrative rather than quantitative.