TECHNICAL ASSET FINGERPRINT
d57f6b5c0a19286edbd9746a
Click to view fullscreen
Press ESC or click to close
FOUND IN PAPERS
EXPERT: healer-alpha-free VERSION 1
RUNTIME: free/openrouter/healer-alpha
INTEL_VERIFIED
## Diagram: FLoD-3DGS Pipeline and Components
### Overview
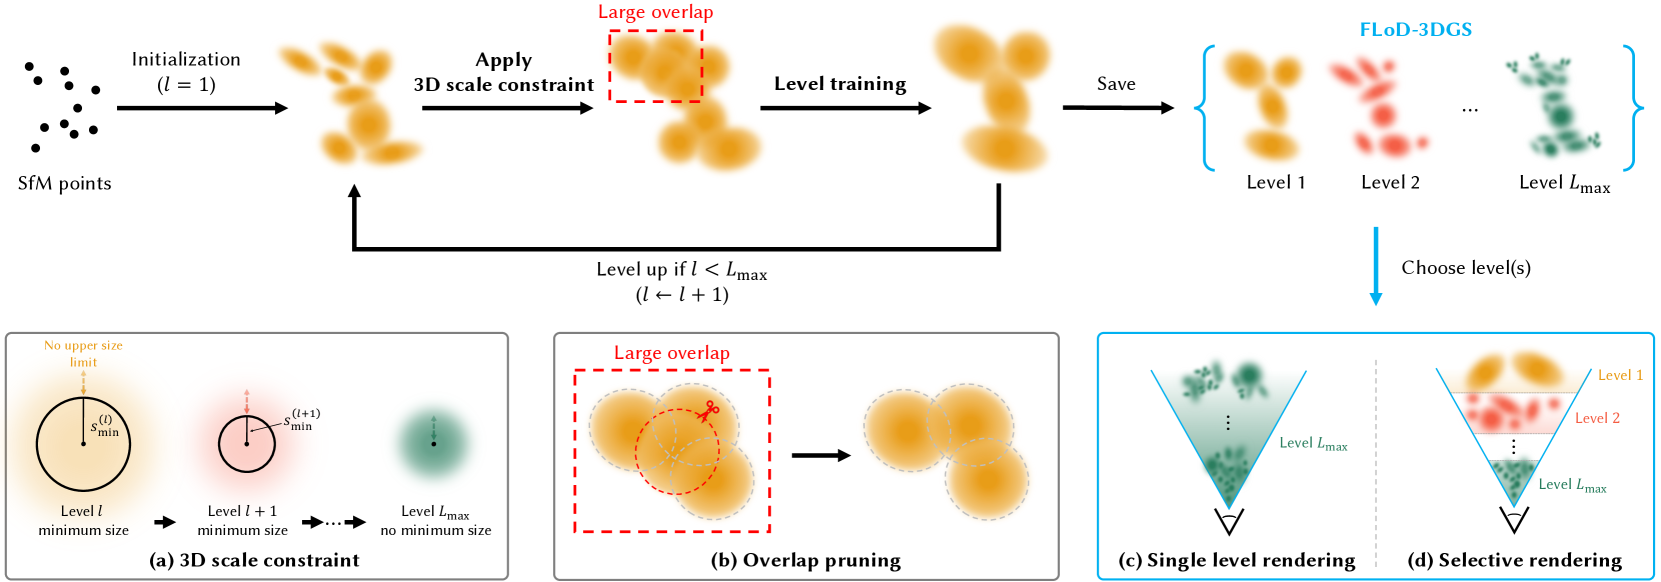
The image is a technical diagram illustrating the pipeline and key components of a method called **FLoD-3DGS**. It depicts a multi-level training and rendering process for 3D Gaussian Splatting, starting from Structure-from-Motion (SfM) points. The diagram is divided into a main process flow at the top and four detailed explanatory sub-diagrams at the bottom, labeled (a), (b), (c), and (d).
### Components/Axes
The diagram is organized into two primary regions:
1. **Main Pipeline (Top Region):** A horizontal flowchart showing the iterative training process.
2. **Detailed Sub-diagrams (Bottom Region):** Four panels explaining specific steps within the pipeline.
**Textual Elements and Labels:**
* **Main Pipeline Labels:** "SfM points", "Initialization (l = 1)", "Apply 3D scale constraint", "Large overlap" (red annotation), "Level training", "Save", "Level up if l < L_max (l ← l + 1)", "FLoD-3DGS", "Choose level(s)".
* **Sub-diagram (a) Title:** "(a) 3D scale constraint".
* **Sub-diagram (b) Title:** "(b) Overlap pruning".
* **Sub-diagram (c) Title:** "(c) Single level rendering".
* **Sub-diagram (d) Title:** "(d) Selective rendering".
* **Additional Text in Sub-diagrams:** "No upper size limit", "Level l minimum size", "Level l+1 minimum size", "Level L_max no minimum size", "Large overlap", "Level 1", "Level 2", "Level L_max".
### Detailed Analysis
#### Main Pipeline Flow
The process begins on the far left with a cluster of black dots labeled **"SfM points"**.
1. **Initialization (l = 1):** An arrow points to a cluster of large, diffuse orange Gaussian ellipsoids, representing the initial 3D Gaussians at level 1.
2. **Apply 3D scale constraint:** The next step shows the Gaussians with a red dashed box highlighting an area of **"Large overlap"**.
3. **Level training:** The Gaussians are shown after training, appearing slightly more refined.
4. **Save:** The trained Gaussians for the current level are saved.
5. **Level up if l < L_max (l ← l + 1):** A feedback loop arrow returns to the "Apply 3D scale constraint" step, indicating the process repeats for the next level (l+1). This continues until the maximum level, L_max, is reached.
6. **Output - FLoD-3DGS:** The final output is a set of saved Gaussian models for each level, displayed in a row: **Level 1** (orange), **Level 2** (red), ..., **Level L_max** (green). These are enclosed in a blue bracket labeled **"FLoD-3DGS"**.
7. **Choose level(s):** A blue arrow points downward from the saved levels to the rendering sub-diagrams, indicating the user can select which level(s) to use for rendering.
#### Sub-diagram (a): 3D scale constraint
This panel explains how the minimum size of Gaussians changes across levels.
* **Left (Level l):** A large circle with a radius labeled **"s_min^(l)"** and the annotation **"No upper size limit"**. The caption reads **"Level l minimum size"**.
* **Middle (Level l+1):** A smaller circle with a radius labeled **"s_min^(l+1)"**. The caption reads **"Level l+1 minimum size"**.
* **Right (Level L_max):** A very small, dense green Gaussian with a dot at its center. The caption reads **"Level L_max no minimum size"**.
* **Flow:** Arrows connect the stages, showing a progression from larger minimum sizes at lower levels to no minimum size at the highest level (L_max).
#### Sub-diagram (b): Overlap pruning
This panel details the process of reducing overlap between Gaussians.
* **Left:** A cluster of orange Gaussians inside a red dashed box labeled **"Large overlap"**. A red scissors icon is shown cutting one Gaussian.
* **Right:** The same cluster after pruning, with the Gaussians now having less overlap and more distinct boundaries.
#### Sub-diagrams (c) & (d): Rendering Modes
These two panels, side-by-side, illustrate different rendering strategies using a camera frustum (inverted pyramid) as a visual metaphor.
* **(c) Single level rendering:** The frustum is filled uniformly with green Gaussians from **"Level L_max"**. This represents rendering using only the highest-detail level.
* **(d) Selective rendering:** The frustum is stratified. The top (closest to camera) contains orange Gaussians from **"Level 1"**, the middle contains red Gaussians from **"Level 2"**, and the bottom (farthest) contains green Gaussians from **"Level L_max"**. This represents a multi-scale rendering approach where different levels are used for different depth ranges or regions.
### Key Observations
1. **Iterative, Multi-Level Process:** The core of FLoD-3DGS is an iterative loop that trains and saves Gaussian models at progressively finer levels (from l=1 to L_max).
2. **Constraint Evolution:** The 3D scale constraint (sub-diagram a) becomes less restrictive with each level, allowing for smaller and more detailed Gaussians as the process advances.
3. **Overlap Management:** Explicit overlap pruning (sub-diagram b) is a key step to maintain quality and prevent redundancy in the Gaussian representation.
4. **Flexible Rendering:** The method supports two distinct rendering paradigms: using a single high-detail level or a selective, multi-level approach (sub-diagrams c & d).
### Interpretation
The FLoD-3DGS pipeline describes a method for creating a **hierarchical representation of a 3D scene** using Gaussian Splatting. The process starts with a coarse model (Level 1) and iteratively refines it by adding levels with smaller, more precise Gaussians. The "3D scale constraint" ensures that each new level can represent finer details than the previous one. "Overlap pruning" is a critical optimization step to ensure the representation remains efficient and visually coherent.
The final output is not a single model, but a **library of models at different scales** (Level 1 to L_max). This enables the **"Selective rendering"** strategy, which is the key innovation suggested by the diagram. Instead of rendering the entire scene with the most computationally expensive, high-detail model (Level L_max), the system can intelligently choose which level to use for different parts of the scene—likely using coarser levels for distant or simple regions and finer levels for close-up or complex areas. This approach aims to achieve an optimal balance between rendering quality and computational efficiency, adapting the level of detail dynamically based on the viewer's perspective or scene requirements. The diagram effectively communicates that FLoD-3DGS is a framework for building and utilizing multi-scale 3D Gaussian representations.
DECODING INTELLIGENCE...