\n
## Diagram: Large Language Model Evaluation Metrics
### Overview
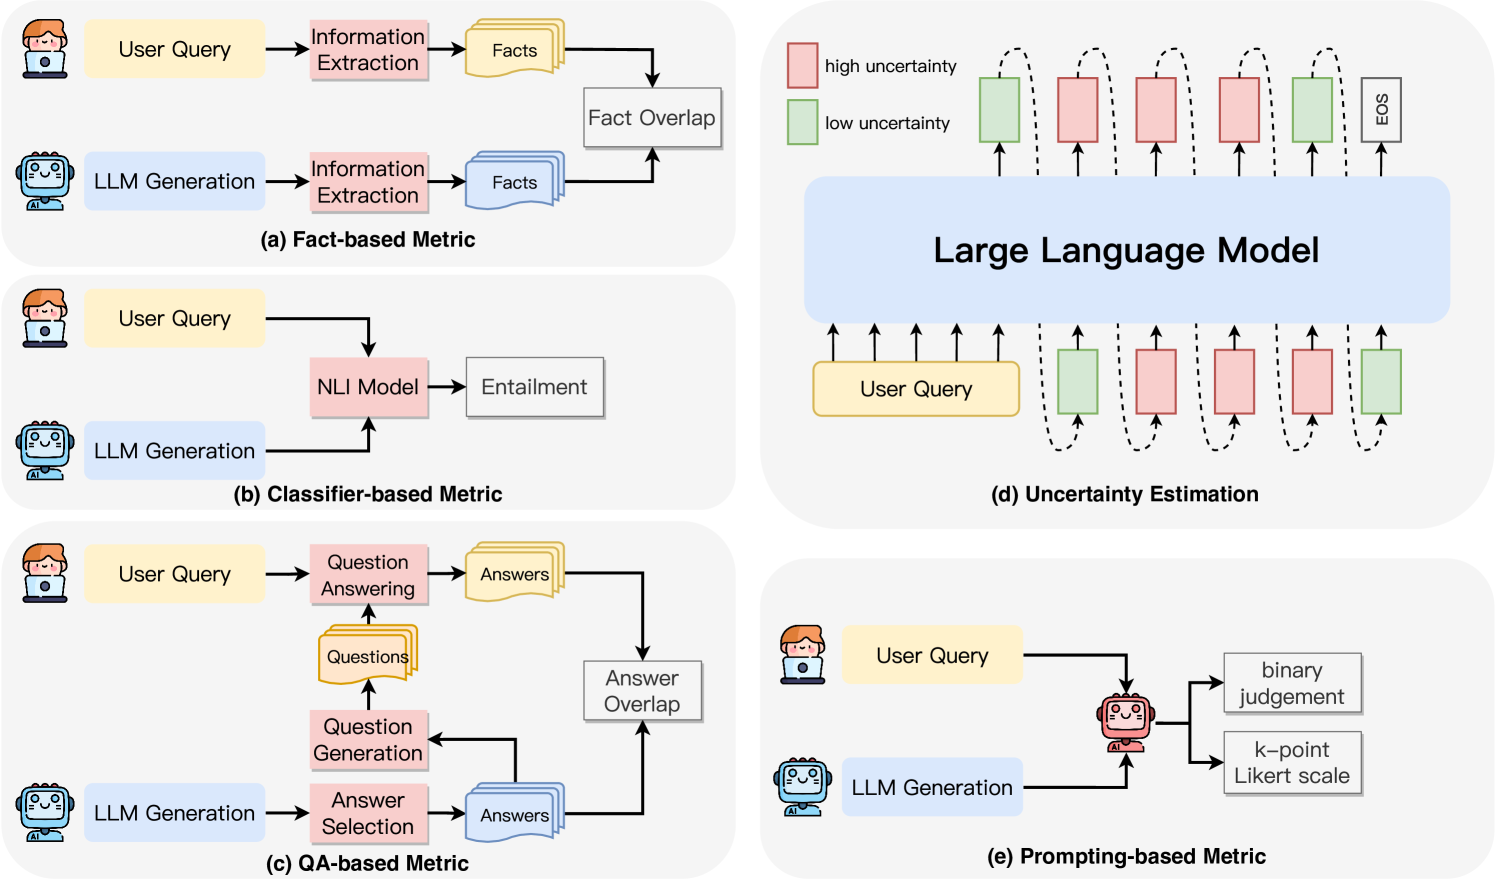
The image presents a diagram illustrating five different metrics used to evaluate Large Language Models (LLMs). Each metric is depicted as a flow diagram showing the interaction between a "User Query" and "LLM Generation," along with the intermediate steps and final evaluation. The diagram is organized into five sub-panels labeled (a) through (e).
### Components/Axes
The diagram consists of the following key components:
* **User Query:** Represented by a head icon.
* **LLM Generation:** Represented by a robot icon.
* **Information Extraction:** A process box.
* **Facts:** A rectangular box representing extracted factual information.
* **Fact Overlap:** A process box indicating the degree of overlap between extracted facts.
* **NLI Model:** Natural Language Inference model.
* **Entailment:** A process box indicating the degree of entailment.
* **Question Answering:** A process box.
* **Answers:** A rectangular box representing generated answers.
* **Question Generation:** A process box.
* **Answer Selection:** A process box.
* **Answer Overlap:** A process box indicating the degree of overlap between answers.
* **Uncertainty Estimation:** A process box.
* **EOS:** End of Sequence marker.
* **Binary Judgement:** A process box.
* **k-point Likert scale:** A process box.
* **Arrows:** Indicate the flow of information between components.
* **Sub-panel Labels:** (a) Fact-based Metric, (b) Classifier-based Metric, (c) QA-based Metric, (d) Uncertainty Estimation, (e) Prompting-based Metric.
### Detailed Analysis or Content Details
**(a) Fact-based Metric:**
* User Query -> Information Extraction -> Facts (yellow)
* LLM Generation -> Information Extraction -> Facts (yellow)
* Facts (yellow) from both sources -> Fact Overlap (teal)
* A series of rectangles are shown with a gradient from light pink (low uncertainty) to dark pink (high uncertainty). The rectangles are arranged horizontally, with the first rectangle being light pink and the last being dark pink. An "EOS" rectangle is at the end.
**(b) Classifier-based Metric:**
* User Query -> NLI Model -> Entailment (purple)
* LLM Generation -> NLI Model
* The arrow from LLM Generation to NLI Model is curved, indicating a relationship.
**(c) QA-based Metric:**
* User Query -> Question Answering -> Answers (blue)
* LLM Generation -> Question Generation -> Answers (blue)
* Answers (blue) from both sources -> Answer Overlap (teal)
**(d) Uncertainty Estimation:**
* User Query -> LLM Generation
* A series of rectangles are shown with a gradient from light green (low uncertainty) to dark green (high uncertainty). The rectangles are arranged horizontally, with the first rectangle being light green and the last being dark green. Arrows point upwards from "User Query" to each rectangle.
**(e) Prompting-based Metric:**
* User Query -> LLM Generation
* LLM Generation -> Binary Judgement
* LLM Generation -> k-point Likert scale
### Key Observations
* All metrics involve a comparison between the LLM's output and some form of ground truth or expected response.
* Metrics (a) and (c) utilize overlap as a key evaluation component.
* Metric (d) visually represents uncertainty levels, with a clear gradient indicating increasing uncertainty.
* Metric (b) uses a Natural Language Inference (NLI) model to assess the relationship between the user query and the LLM's generation.
* Metric (e) relies on human judgement using binary or Likert scale assessments.
### Interpretation
The diagram illustrates a variety of approaches to evaluating the performance of Large Language Models. The choice of metric depends on the specific aspect of performance being assessed. The fact-based metric (a) focuses on the factual accuracy of the LLM's output. The classifier-based metric (b) assesses the logical relationship between the query and the response. The QA-based metric (c) evaluates the LLM's ability to answer questions correctly. The uncertainty estimation metric (d) provides insight into the LLM's confidence in its predictions. Finally, the prompting-based metric (e) relies on human evaluation to assess the quality of the LLM's output.
The visual representation of uncertainty in metric (d) is particularly noteworthy, as it highlights the importance of considering not only the correctness of the LLM's output but also its level of confidence. The use of different colors (yellow, purple, blue, green, teal, pink) to represent different components and processes helps to visually distinguish the various metrics and their underlying mechanisms. The diagram provides a comprehensive overview of the key considerations in evaluating LLMs, and it can be used as a valuable resource for researchers and practitioners in the field.