\n
## Line Chart: Global EV Plug Availability
### Overview
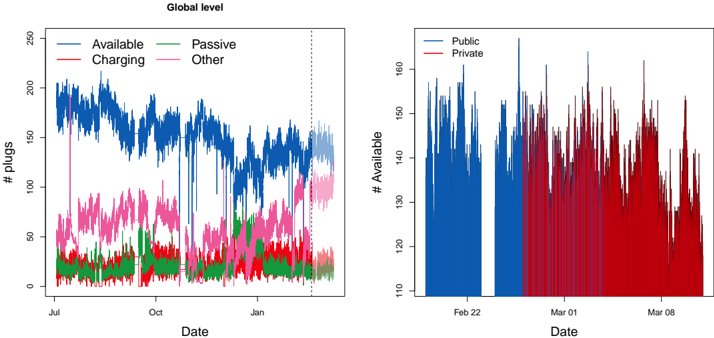
The image presents two line charts displaying the number of electric vehicle (EV) plugs available over time. The left chart shows a breakdown by plug status (Available, Charging, Passive, Other) at a "Global level". The right chart shows a breakdown by plug type (Public, Private) over a shorter time period. Both charts use a time-series format with 'Date' on the x-axis and '# plugs' or '# Available' on the y-axis.
### Components/Axes
**Left Chart:**
* **Title:** "Global level" (top-center)
* **X-axis Label:** "Date" (bottom-center)
* **Y-axis Label:** "# plugs" (left-center)
* **Legend:** Located in the top-left corner.
* Blue: "Available"
* Red: "Charging"
* Green: "Passive"
* Pink: "Other"
* **Vertical dashed line:** Approximately at the date of January 1st.
**Right Chart:**
* **X-axis Label:** "Date" (bottom-center)
* **Y-axis Label:** "# Available" (left-center)
* **Legend:** Located in the top-left corner.
* Blue: "Public"
* Red: "Private"
### Detailed Analysis or Content Details
**Left Chart:**
* **Available (Blue):** The line fluctuates between approximately 150 and 220 plugs. It generally declines from July to January, with a slight upward trend in the last few weeks of the displayed period.
* July: ~210 plugs
* August: ~190 plugs
* September: ~170 plugs
* October: ~150 plugs
* November: ~160 plugs
* December: ~140 plugs
* January: ~150 plugs
* **Charging (Red):** The line fluctuates between approximately 50 and 110 plugs. It shows a general increase from July to October, then a decline to January.
* July: ~60 plugs
* August: ~70 plugs
* September: ~80 plugs
* October: ~90 plugs
* November: ~70 plugs
* December: ~60 plugs
* January: ~50 plugs
* **Passive (Green):** The line fluctuates between approximately 20 and 60 plugs. It remains relatively stable throughout the period.
* July: ~30 plugs
* January: ~30 plugs
* **Other (Pink):** The line fluctuates between approximately 0 and 30 plugs. It remains relatively low throughout the period.
* July: ~10 plugs
* January: ~10 plugs
**Right Chart:**
* **Public (Blue):** The line fluctuates between approximately 110 and 160 plugs. It shows a highly variable pattern with frequent peaks and troughs.
* Feb 22: ~120 plugs
* Mar 01: ~160 plugs
* Mar 08: ~130 plugs
* **Private (Red):** The line fluctuates between approximately 110 and 160 plugs. It also shows a highly variable pattern, often mirroring the Public line but with differing peak times.
* Feb 22: ~110 plugs
* Mar 01: ~120 plugs
* Mar 08: ~150 plugs
### Key Observations
* The "Available" plugs consistently represent the largest portion of the total plugs in the left chart.
* The right chart shows a strong correlation between the availability of Public and Private plugs, suggesting they are often used in conjunction.
* The vertical dashed line in the left chart may indicate a significant event or change in EV plug usage patterns.
* The right chart shows a much shorter time frame, and a higher degree of volatility.
### Interpretation
The data suggests a dynamic EV charging landscape. The left chart provides a global overview of plug status, indicating that a significant number of plugs are generally available, but a substantial portion are also in use (Charging). The decline in available plugs from July to January could be due to increased EV adoption or seasonal usage patterns. The "Passive" and "Other" categories represent a small fraction of the total, potentially indicating plugs that are temporarily unavailable or used for other purposes.
The right chart focuses on the distinction between Public and Private plugs. The high variability suggests that plug availability is influenced by factors such as time of day, location, and user behavior. The correlation between Public and Private plugs suggests that users may switch between the two depending on their needs. The shorter time frame and higher volatility in the right chart could be due to the more localized nature of the data.
The vertical dashed line in the left chart could represent a policy change, a major EV launch, or a significant shift in consumer behavior. Further investigation would be needed to determine the cause of this potential inflection point. Overall, the data highlights the growing demand for EV charging infrastructure and the need for continued investment and optimization.