## Bar Chart: Model Performance Improvement with KGoT Method
### Overview
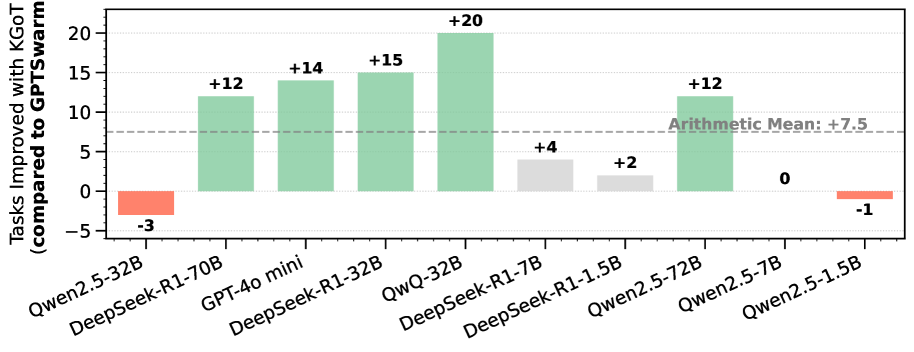
This is a vertical bar chart comparing the performance improvement of various large language models (LLMs) when using a method called "KGoT" versus a baseline method called "GPTswarm." The chart quantifies the improvement in terms of "Tasks Improved." The overall trend shows that most models experience a positive improvement, with a calculated arithmetic mean improvement of +7.5 tasks.
### Components/Axes
* **Chart Type:** Vertical Bar Chart.
* **Y-Axis (Vertical):**
* **Label:** "Tasks Improved with KGoT (compared to GPTswarm)"
* **Scale:** Linear scale ranging from -5 to 20.
* **Major Gridlines:** Horizontal lines at intervals of 5 units (0, 5, 10, 15, 20).
* **X-Axis (Horizontal):**
* **Label:** None explicit. Contains categorical labels for different AI models.
* **Categories (from left to right):**
1. Qwen2.5-32B
2. DeepSeek-R1-70B
3. GPT-4o mini
4. DeepSeek-R1-32B
5. QwQ-32B
6. DeepSeek-R1-7B
7. DeepSeek-R1-1.5B
8. Qwen2.5-72B
9. Qwen2.5-7B
10. Qwen2.5-1.5B
* **Legend/Color Coding:** While not in a separate box, color is used functionally:
* **Green Bars:** Indicate a positive improvement value.
* **Red/Salmon Bars:** Indicate a negative improvement value (performance regression).
* **Light Gray Bars:** Indicate a small positive improvement value (near zero).
* **Reference Line:** A horizontal dashed gray line is drawn across the chart at the Y-axis value of **+7.5**. It is labeled in the upper-right quadrant of the chart area as **"Arithmetic Mean: +7.5"**.
### Detailed Analysis
Each bar's value is explicitly annotated above or below it. The data series, from left to right, is as follows:
1. **Qwen2.5-32B:** Bar extends downward to **-3**. (Color: Red)
2. **DeepSeek-R1-70B:** Bar extends upward to **+12**. (Color: Green)
3. **GPT-4o mini:** Bar extends upward to **+14**. (Color: Green)
4. **DeepSeek-R1-32B:** Bar extends upward to **+15**. (Color: Green)
5. **QwQ-32B:** Bar extends upward to **+20**. This is the highest value on the chart. (Color: Green)
6. **DeepSeek-R1-7B:** Bar extends upward to **+4**. (Color: Light Gray)
7. **DeepSeek-R1-1.5B:** Bar extends upward to **+2**. (Color: Light Gray)
8. **Qwen2.5-72B:** Bar extends upward to **+12**. (Color: Green)
9. **Qwen2.5-7B:** Bar has no height, annotated with **0**. (Color: Not distinctly colored, appears as a line on the axis)
10. **Qwen2.5-1.5B:** Bar extends downward to **-1**. (Color: Red)
**Trend Verification:** The visual trend shows a cluster of strong positive performance (green bars) for several 32B and 70B parameter models, with the peak at QwQ-32B. Smaller models (1.5B, 7B) show minimal gains (gray bars). Two models from the Qwen2.5 series (32B and 1.5B) show negative results (red bars).
### Key Observations
* **Highest Performer:** **QwQ-32B** shows the greatest improvement with **+20** tasks.
* **Lowest Performer:** **Qwen2.5-32B** shows the greatest regression with **-3** tasks.
* **Model Size Correlation:** There is a loose, non-linear correlation where mid-to-large size models (32B, 70B) tend to show larger improvements, but this is not absolute (e.g., Qwen2.5-72B at +12 is lower than the 32B models from other series).
* **Series Variance:** The **Qwen2.5** model series shows high variance in results, ranging from -3 to +12, with the smallest model (1.5B) also showing a slight regression (-1).
* **Mean Performance:** The arithmetic mean of **+7.5** is explicitly provided, serving as a benchmark. Six models perform above this mean, and four perform at or below it.
### Interpretation
The data suggests that the "KGoT" method provides a net positive benefit across the tested suite of models, as indicated by the positive arithmetic mean. However, its effectiveness is highly model-dependent.
* **Method Efficacy:** KGoT appears particularly effective for the **DeepSeek-R1** and **GPT-4o mini** models in the tested configurations, consistently yielding improvements between +12 and +15, with the standout result from **QwQ-32B**.
* **Model-Specific Behavior:** The inconsistent results within the **Qwen2.5** family (from -3 to +12) imply that the method's success may depend on factors beyond just model size, such as architecture, training data, or specific task alignment. The negative results for two Qwen models indicate that KGoT can, in some cases, degrade performance compared to the GPTswarm baseline.
* **Practical Implication:** A practitioner would conclude that KGoT is a promising technique worth investigating, especially for models like DeepSeek-R1 and QwQ, but it requires careful validation for each specific model, as it is not universally beneficial. The chart effectively argues that one cannot assume a single method will work equally well across all state-of-the-art LLMs.