## Process Diagram: Synthetic Problem Generation and Filtering Pipeline
### Overview
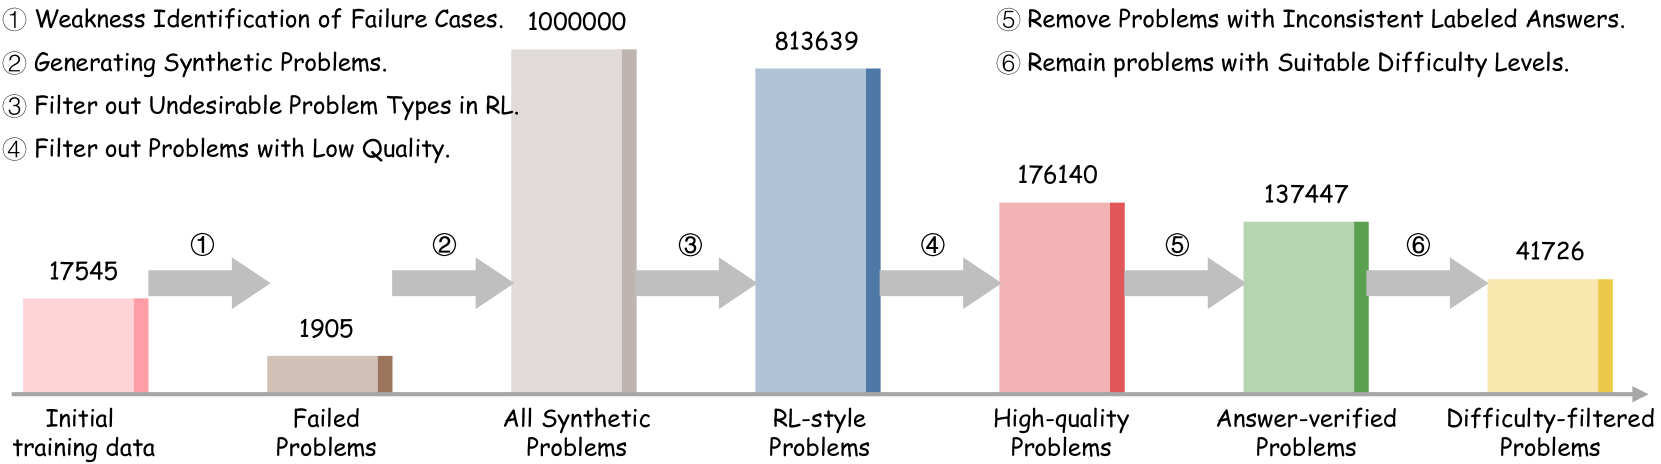
The image displays a horizontal flowchart illustrating a multi-stage data processing pipeline for refining a problem dataset. The process begins with initial training data and ends with a filtered set of "Difficulty-filtered Problems." Each stage is represented by a colored bar whose height corresponds to the quantity of problems at that stage. The flow is indicated by gray arrows, each labeled with a circled number (① to ⑥) that corresponds to a specific processing step described in the header.
### Components/Axes
**Header (Processing Steps):**
The top of the image lists six sequential processing steps:
1. Weakness Identification of Failure Cases.
2. Generating Synthetic Problems.
3. Filter out Undesirable Problem Types in RL.
4. Filter out Problems with Low Quality.
5. Remove Problems with Inconsistent Labeled Answers.
6. Remain problems with Suitable Difficulty Levels.
**Main Chart (Pipeline Stages):**
The pipeline consists of seven stages, each with a labeled bar and a numerical value above it. The stages are connected by arrows indicating the flow of data.
| Stage Position (Left to Right) | Label (Below Bar) | Quantity (Above Bar) | Bar Color | Corresponding Process Step (Arrow Label) |
| :--- | :--- | :--- | :--- | :--- |
| 1 | Initial training data | 17545 | Pink | ① |
| 2 | Failed Problems | 1905 | Brown | ② |
| 3 | All Synthetic Problems | 1000000 | Light Gray | ③ |
| 4 | RL-style Problems | 813639 | Blue | ④ |
| 5 | High-quality Problems | 176140 | Red | ⑤ |
| 6 | Answer-verified Problems | 137447 | Green | ⑥ |
| 7 | Difficulty-filtered Problems | 41726 | Yellow | (Final Output) |
### Detailed Analysis
The pipeline demonstrates a significant reduction in dataset size through successive filtering:
1. **Initial Data & Failure Identification (①):** The process starts with 17,545 problems from "Initial training data." Step ①, "Weakness Identification of Failure Cases," isolates a subset of 1,905 "Failed Problems."
2. **Synthetic Generation (②):** Step ②, "Generating Synthetic Problems," massively expands the dataset to 1,000,000 "All Synthetic Problems." This is the largest volume in the pipeline.
3. **Sequential Filtering (③-⑥):** The subsequent steps apply rigorous filters, drastically reducing the count:
* **Step ③ (Filter by Problem Type):** Reduces the set to 813,639 "RL-style Problems."
* **Step ④ (Filter by Quality):** Further reduces the set to 176,140 "High-quality Problems."
* **Step ⑤ (Filter by Answer Consistency):** Results in 137,447 "Answer-verified Problems."
* **Step ⑥ (Filter by Difficulty):** The final step yields 41,726 "Difficulty-filtered Problems."
### Key Observations
* **Massive Expansion and Contraction:** The pipeline features a dramatic expansion phase (from ~19k to 1M problems) followed by a severe contraction phase (from 1M to ~42k problems), indicating a "generate-then-filter" strategy.
* **Filtering Efficacy:** Each filtering step removes a substantial portion of the data. The most significant single reduction occurs between "All Synthetic Problems" (1,000,000) and "RL-style Problems" (813,639), a loss of ~186k problems. The final four filtering steps (④-⑥) collectively reduce the dataset by over 95% from its synthetic peak.
* **Final Yield:** The process results in a final dataset of 41,726 problems, which is approximately 2.38 times the size of the initial training data (17,545).
### Interpretation
This diagram outlines a sophisticated data curation methodology, likely for training or evaluating a machine learning model, particularly in a Reinforcement Learning (RL) context. The process suggests a focus on quality over quantity. The initial "Weakness Identification" implies using model failures to guide the generation of new, targeted synthetic problems. The subsequent multi-stage filtering—addressing problem type, quality, answer consistency, and difficulty—demonstrates a comprehensive approach to constructing a high-fidelity, reliable, and pedagogically useful dataset. The final "Difficulty-filtered" set is presumably balanced to provide an appropriate challenge level. The pipeline's structure highlights the computational and analytical investment required to move from raw or initial data to a refined, high-value training resource.