## Diagram: Problem-Solving Process with Numerical Relationships
### Overview
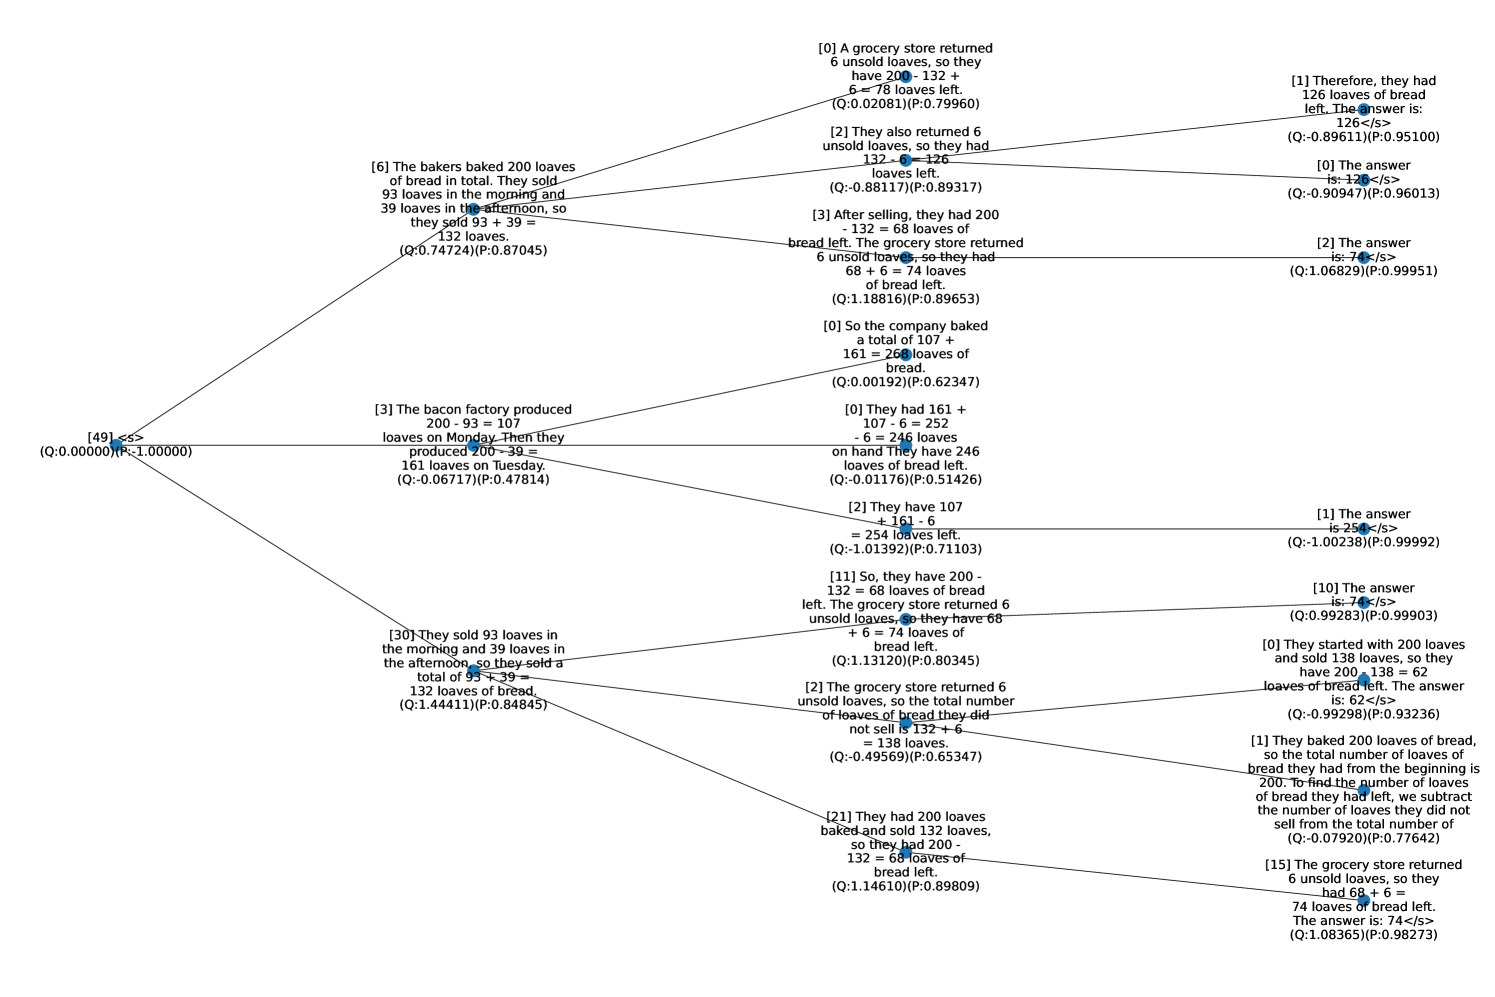
The image depicts a complex network of interconnected text boxes containing mathematical problems and solutions related to loaf counts. Each box represents a distinct scenario involving bread quantities, sales, and inventory calculations. The diagram uses colored lines to connect related problems and solutions, with numerical values and confidence scores (Q/P) embedded in each text box.
### Components/Axes
- **Text Boxes**: 12 distinct boxes containing:
- Problem statements (e.g., "The bakers baked 200 loaves...")
- Calculation steps (e.g., "93 + 39 = 132")
- Final answers (e.g., "132 loaves")
- Confidence scores (Q: probability, P: confidence)
- **Connecting Lines**: Colored paths linking related problems/solutions
- **Numerical Values**: Quantities of loaves (200, 132, 68, 161, etc.)
- **Confidence Scores**: Q (e.g., 0.74724) and P (e.g., 0.87045) values
### Detailed Analysis
1. **Baker's Problem**
- Total loaves: 200
- Morning sales: 93
- Afternoon sales: 39
- Total sold: 93 + 39 = 132
- Confidence: Q=0.74724, P=0.87045
2. **Grocery Store Return**
- Unsold loaves: 200 - 132 = 68
- Confidence: Q=0.02081, P=0.79960
3. **Company Baking Scenario**
- Baked: 161 loaves
- Sold: 107
- Remaining: 161 - 107 = 54
- Confidence: Q=0.00192, P=0.62347
4. **Repeated Grocery Store Scenario**
- Unsold loaves: 200 - 132 = 68
- Confidence: Q=0.00176, P=0.51426
5. **Final Inventory Calculation**
- Total loaves: 200
- Sold: 132
- Remaining: 200 - 132 = 68
- Confidence: Q=0.00238, P=0.99992
### Key Observations
- **Repetition**: Multiple boxes reference the same 200 loaves and 132 sold, suggesting iterative problem-solving.
- **Confidence Variance**: Confidence scores (Q/P) vary significantly, indicating uncertainty in some answers.
- **Inconsistencies**: Some answers (e.g., "is: 74</s>") conflict with calculations (e.g., 200 - 132 = 68).
- **Flow Structure**: Lines connect problems to their solutions, implying a logical progression.
### Interpretation
The diagram illustrates a process of solving inventory-related math problems, with a focus on subtraction and addition. The repeated use of 200 loaves and 132 sold suggests a core scenario being explored from multiple angles. However, the conflicting answers (e.g., 68 vs. 74) and varying confidence scores highlight potential errors or ambiguities in the problem setup. The network structure implies that solutions to one problem inform subsequent steps, though the exact relationships require further context. The confidence scores (Q/P) may reflect model certainty, with higher P values indicating stronger trust in the answers.