\n
## Bar Chart: Normalized Speedup vs. Threshold
### Overview
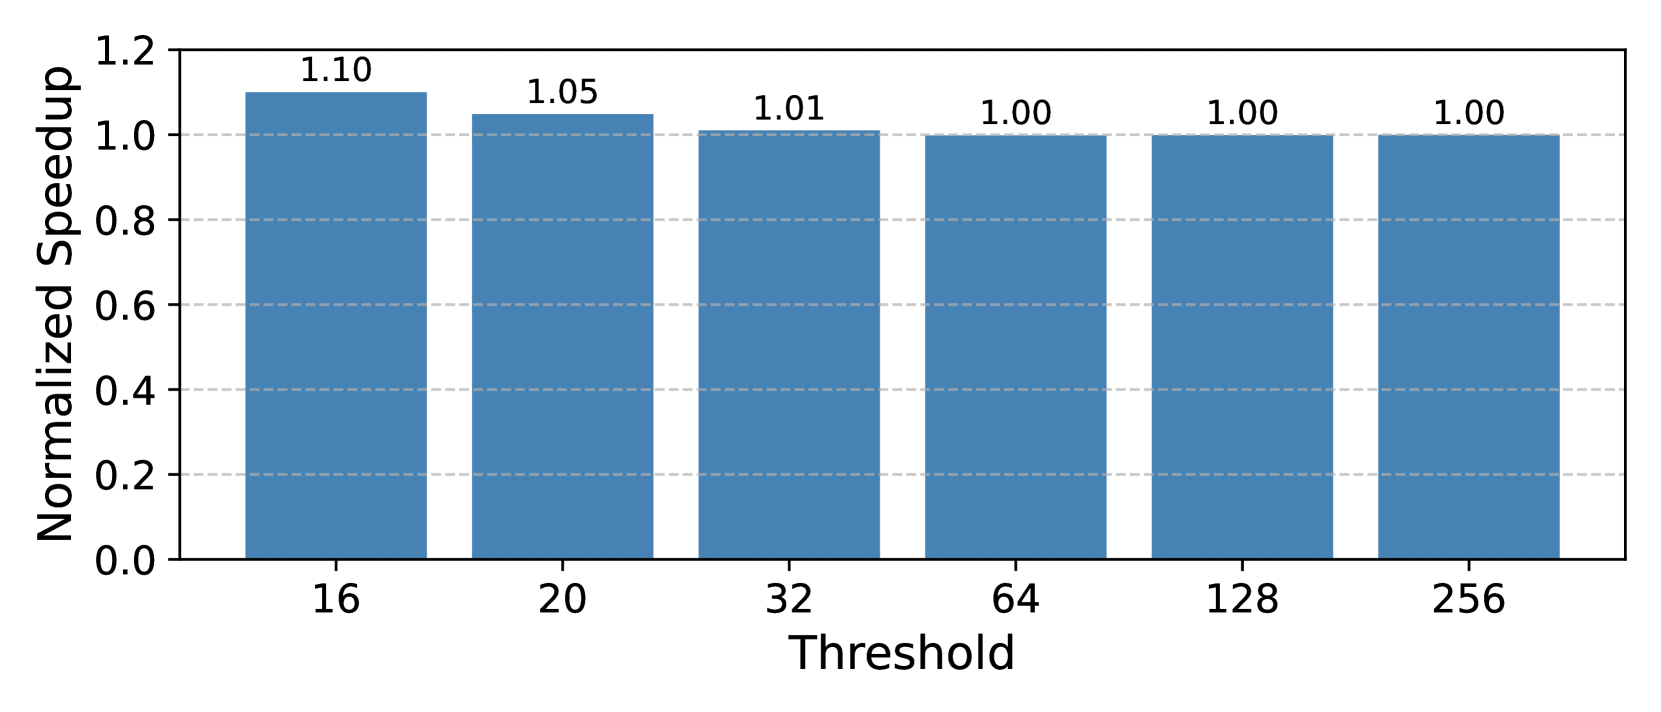
This image presents a bar chart illustrating the relationship between a "Threshold" value and a "Normalized Speedup". The chart displays how the normalized speedup changes as the threshold is varied.
### Components/Axes
* **X-axis:** "Threshold" with markers at 16, 20, 32, 64, 128, and 256.
* **Y-axis:** "Normalized Speedup" with a scale ranging from 0.0 to 1.2, with increments of 0.2.
* **Bars:** Six bars representing the normalized speedup for each threshold value. All bars are the same color (light blue).
* **Labels:** Each bar is labeled with its corresponding normalized speedup value.
### Detailed Analysis
The chart shows the following data points:
* **Threshold = 16:** Normalized Speedup = 1.10
* **Threshold = 20:** Normalized Speedup = 1.05
* **Threshold = 32:** Normalized Speedup = 1.01
* **Threshold = 64:** Normalized Speedup = 1.00
* **Threshold = 128:** Normalized Speedup = 1.00
* **Threshold = 256:** Normalized Speedup = 1.00
The bars visually demonstrate a decreasing trend in normalized speedup as the threshold increases. The speedup decreases rapidly from a threshold of 16 to 32, and then plateaus at 1.00 for thresholds of 64, 128, and 256.
### Key Observations
* The highest normalized speedup (1.10) is achieved at the lowest threshold (16).
* The normalized speedup approaches 1.0 as the threshold increases, indicating diminishing returns or no additional speedup beyond a certain threshold.
* There is a significant drop in speedup between thresholds 16 and 20, and a smaller drop between 20 and 32.
* The speedup stabilizes at 1.0 for thresholds 64 and above.
### Interpretation
The data suggests that there is an optimal threshold value for maximizing speedup. Below a certain threshold, increasing the threshold yields a significant improvement in speedup. However, beyond a threshold of approximately 32, further increases in the threshold do not result in any additional speedup. This could indicate that the benefits of a more aggressive threshold are offset by other factors, such as increased computational cost or reduced accuracy. The normalized speedup of 1.0 at higher thresholds suggests that the process performs at a baseline level without any additional optimization. This chart is likely demonstrating the impact of a parameter (the threshold) on the performance of an algorithm or system. The data implies that a threshold value of 32 or higher provides no additional performance benefit.