TECHNICAL ASSET FINGERPRINT
d68e65c6f41234d1ceb8a26d
Click to view fullscreen
Press ESC or click to close
FOUND IN PAPERS
EXPERT: gemini-2.0-flash VERSION 1
RUNTIME: nugit/gemini/gemini-2.0-flash
INTEL_VERIFIED
## Heatmap: Model Performance Across Categories
### Overview
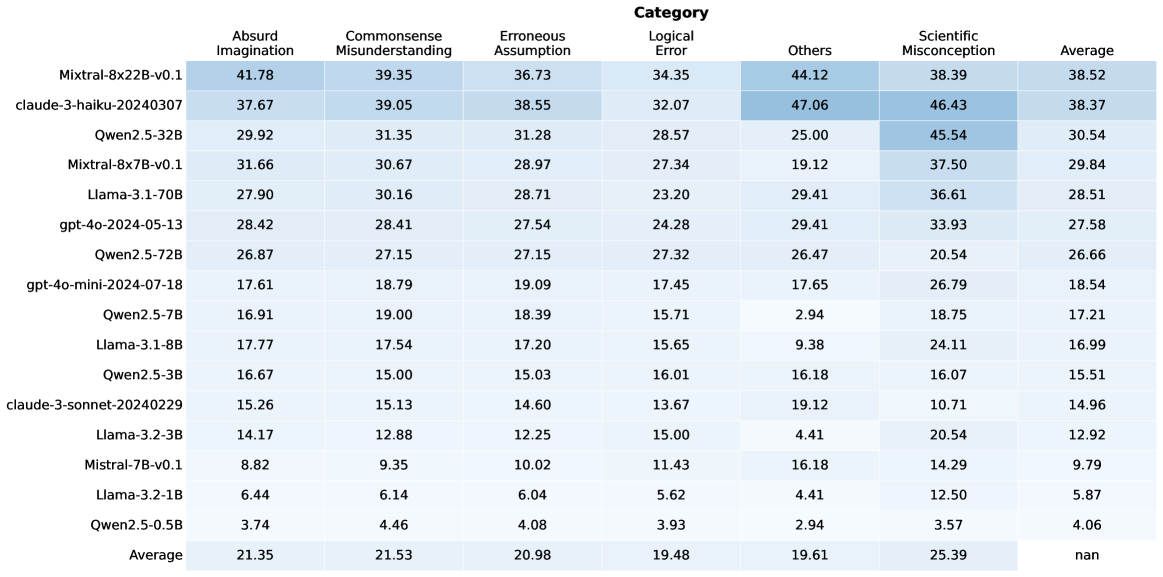
The image is a heatmap displaying the performance of various language models across different categories of errors or misconceptions. The rows represent the models, and the columns represent the categories. The cells contain numerical values, presumably representing error rates or some other performance metric, with a color gradient indicating the magnitude of the value.
### Components/Axes
* **Rows (Models):**
* Mixtral-8x22B-v0.1
* claude-3-haiku-20240307
* Qwen2.5-32B
* Mixtral-8x7B-v0.1
* Llama-3.1-70B
* gpt-4o-2024-05-13
* Qwen2.5-72B
* gpt-4o-mini-2024-07-18
* Qwen2.5-7B
* Llama-3.1-8B
* Qwen2.5-3B
* claude-3-sonnet-20240229
* Llama-3.2-3B
* Mistral-7B-v0.1
* Llama-3.2-1B
* Qwen2.5-0.5B
* Average
* **Columns (Categories):**
* Absurd Imagination
* Commonsense Misunderstanding
* Erroneous Assumption
* Logical Error
* Others
* Scientific Misconception
* Average
### Detailed Analysis or ### Content Details
Here's a breakdown of the data for each model and category:
* **Mixtral-8x22B-v0.1:**
* Absurd Imagination: 41.78
* Commonsense Misunderstanding: 39.35
* Erroneous Assumption: 36.73
* Logical Error: 34.35
* Others: 44.12
* Scientific Misconception: 38.39
* Average: 38.52
* **claude-3-haiku-20240307:**
* Absurd Imagination: 37.67
* Commonsense Misunderstanding: 39.05
* Erroneous Assumption: 38.55
* Logical Error: 32.07
* Others: 47.06
* Scientific Misconception: 46.43
* Average: 38.37
* **Qwen2.5-32B:**
* Absurd Imagination: 29.92
* Commonsense Misunderstanding: 31.35
* Erroneous Assumption: 31.28
* Logical Error: 28.57
* Others: 25.00
* Scientific Misconception: 45.54
* Average: 30.54
* **Mixtral-8x7B-v0.1:**
* Absurd Imagination: 31.66
* Commonsense Misunderstanding: 30.67
* Erroneous Assumption: 28.97
* Logical Error: 27.34
* Others: 19.12
* Scientific Misconception: 37.50
* Average: 29.84
* **Llama-3.1-70B:**
* Absurd Imagination: 27.90
* Commonsense Misunderstanding: 30.16
* Erroneous Assumption: 28.71
* Logical Error: 23.20
* Others: 29.41
* Scientific Misconception: 36.61
* Average: 28.51
* **gpt-4o-2024-05-13:**
* Absurd Imagination: 28.42
* Commonsense Misunderstanding: 28.41
* Erroneous Assumption: 27.54
* Logical Error: 24.28
* Others: 29.41
* Scientific Misconception: 33.93
* Average: 27.58
* **Qwen2.5-72B:**
* Absurd Imagination: 26.87
* Commonsense Misunderstanding: 27.15
* Erroneous Assumption: 27.15
* Logical Error: 27.32
* Others: 26.47
* Scientific Misconception: 20.54
* Average: 26.66
* **gpt-4o-mini-2024-07-18:**
* Absurd Imagination: 17.61
* Commonsense Misunderstanding: 18.79
* Erroneous Assumption: 19.09
* Logical Error: 17.45
* Others: 17.65
* Scientific Misconception: 26.79
* Average: 18.54
* **Qwen2.5-7B:**
* Absurd Imagination: 16.91
* Commonsense Misunderstanding: 19.00
* Erroneous Assumption: 18.39
* Logical Error: 15.71
* Others: 2.94
* Scientific Misconception: 18.75
* Average: 17.21
* **Llama-3.1-8B:**
* Absurd Imagination: 17.77
* Commonsense Misunderstanding: 17.54
* Erroneous Assumption: 17.20
* Logical Error: 15.65
* Others: 9.38
* Scientific Misconception: 24.11
* Average: 16.99
* **Qwen2.5-3B:**
* Absurd Imagination: 16.67
* Commonsense Misunderstanding: 15.00
* Erroneous Assumption: 15.03
* Logical Error: 16.01
* Others: 16.18
* Scientific Misconception: 16.07
* Average: 15.51
* **claude-3-sonnet-20240229:**
* Absurd Imagination: 15.26
* Commonsense Misunderstanding: 15.13
* Erroneous Assumption: 14.60
* Logical Error: 13.67
* Others: 19.12
* Scientific Misconception: 10.71
* Average: 14.96
* **Llama-3.2-3B:**
* Absurd Imagination: 14.17
* Commonsense Misunderstanding: 12.88
* Erroneous Assumption: 12.25
* Logical Error: 15.00
* Others: 4.41
* Scientific Misconception: 20.54
* Average: 12.92
* **Mistral-7B-v0.1:**
* Absurd Imagination: 8.82
* Commonsense Misunderstanding: 9.35
* Erroneous Assumption: 10.02
* Logical Error: 11.43
* Others: 16.18
* Scientific Misconception: 14.29
* Average: 9.79
* **Llama-3.2-1B:**
* Absurd Imagination: 6.44
* Commonsense Misunderstanding: 6.14
* Erroneous Assumption: 6.04
* Logical Error: 5.62
* Others: 4.41
* Scientific Misconception: 12.50
* Average: 5.87
* **Qwen2.5-0.5B:**
* Absurd Imagination: 3.74
* Commonsense Misunderstanding: 4.46
* Erroneous Assumption: 4.08
* Logical Error: 3.93
* Others: 2.94
* Scientific Misconception: 3.57
* Average: 4.06
* **Average:**
* Absurd Imagination: 21.35
* Commonsense Misunderstanding: 21.53
* Erroneous Assumption: 20.98
* Logical Error: 19.48
* Others: 19.61
* Scientific Misconception: 25.39
* Average: nan
### Key Observations
* The "Average" row shows the average performance across all models for each category.
* The "Average" column shows the average performance of each model across all categories.
* The "Average" in the bottom right is "nan", which suggests that the average of the averages is not a meaningful metric in this context.
* The models at the top (Mixtral, Claude) generally have higher error rates across most categories compared to the models at the bottom (Llama, Qwen).
* "Scientific Misconception" tends to have higher values compared to other categories, especially for the top-performing models.
* The "Others" category has a wide range of values, suggesting it encompasses diverse error types.
### Interpretation
The heatmap provides a comparative analysis of language model performance across different error categories. The data suggests that:
* **Model Size/Complexity Matters:** Larger and more complex models (e.g., Mixtral, Claude) tend to exhibit higher error rates in certain categories, possibly due to overfitting or a broader range of potential outputs.
* **Scientific Reasoning is Challenging:** The relatively high error rates in the "Scientific Misconception" category indicate that language models struggle with scientific accuracy and reasoning.
* **Error Distribution Varies:** Different models exhibit different error profiles, with some being more prone to "Absurd Imagination" while others struggle more with "Commonsense Misunderstanding."
* **Smaller Models Can Be More Reliable:** The smaller models (e.g., Qwen2.5-0.5B, Llama-3.2-1B) generally have lower error rates, suggesting they might be more reliable for tasks requiring factual accuracy and logical consistency.
The heatmap is a valuable tool for understanding the strengths and weaknesses of different language models and for identifying areas where further improvement is needed. It also highlights the importance of evaluating models across a diverse range of tasks and error categories to gain a comprehensive understanding of their capabilities.
DECODING INTELLIGENCE...