TECHNICAL ASSET FINGERPRINT
d6a6e3fb0ee43ec61231ee38
Click to view fullscreen
Press ESC or click to close
FOUND IN PAPERS
EXPERT: gemini-2.0-flash VERSION 1
RUNTIME: nugit/gemini/gemini-2.0-flash
INTEL_VERIFIED
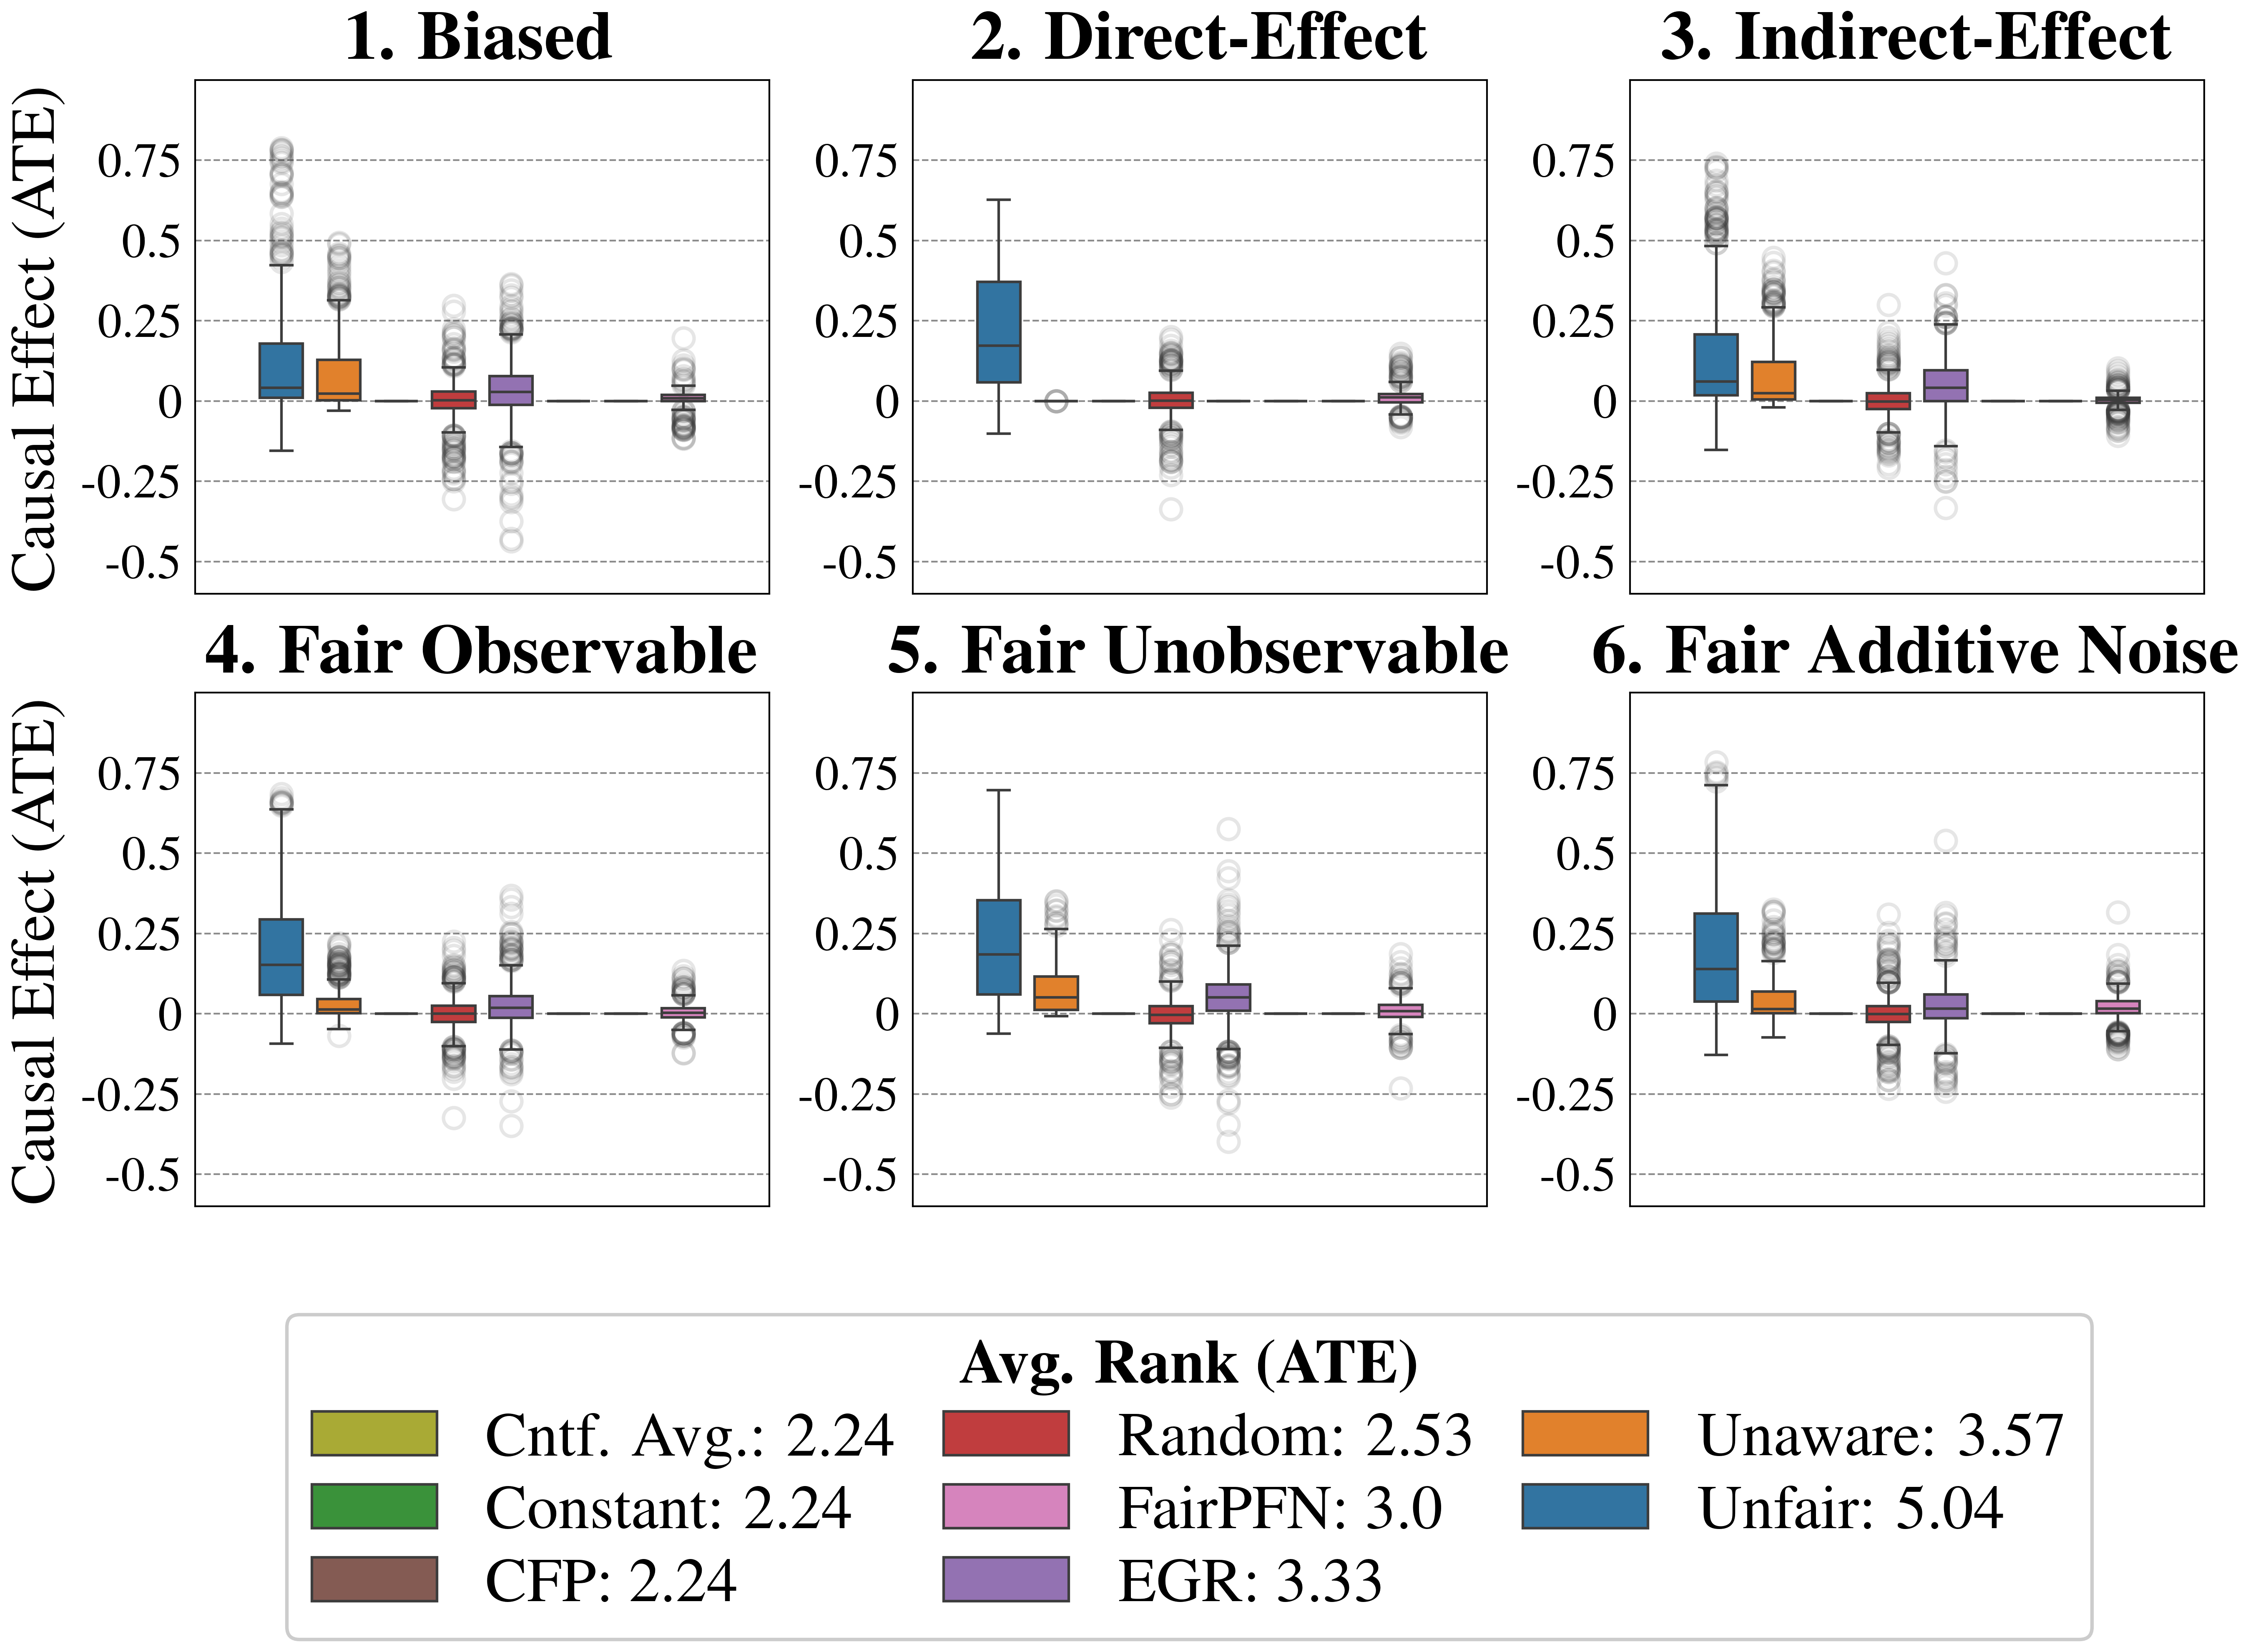
## Box Plot: Causal Effect (ATE) Comparison
### Overview
The image presents six box plots arranged in a 2x3 grid, each representing a different scenario: "Biased", "Direct-Effect", "Indirect-Effect", "Fair Observable", "Fair Unobservable", and "Fair Additive Noise". Each box plot displays the distribution of the Causal Effect (ATE) for six different methods: "Cntf. Avg.", "Constant", "CFP", "Random", "FairPFN", "EGR", "Unaware", and "Unfair". The y-axis represents the Causal Effect (ATE), ranging from -0.5 to 0.75. A legend at the bottom provides the average rank (ATE) for each method.
### Components/Axes
* **Title:** Causal Effect (ATE)
* **Y-axis:** Causal Effect (ATE), with tick marks at -0.5, -0.25, 0, 0.25, 0.5, and 0.75.
* **X-axis:** Implicitly represents the different methods being compared within each scenario.
* **Box Plots:** Each box plot shows the median, quartiles, and outliers for a given method in a specific scenario.
* **Horizontal Grid Lines:** Dashed lines at each y-axis tick mark for visual aid.
* **Titles of Subplots:** 1. Biased, 2. Direct-Effect, 3. Indirect-Effect, 4. Fair Observable, 5. Fair Unobservable, 6. Fair Additive Noise
* **Legend (Bottom):**
* Cntf. Avg.: 2.24 (Olive Green)
* Constant: 2.24 (Green)
* CFP: 2.24 (Brown)
* Random: 2.53 (Red)
* FairPFN: 3.0 (Pink)
* EGR: 3.33 (Purple)
* Unaware: 3.57 (Orange)
* Unfair: 5.04 (Blue)
### Detailed Analysis
**1. Biased**
* **Unfair (Blue):** The box extends from approximately 0.05 to 0.2, with outliers extending up to 0.75.
* **Unaware (Orange):** The box extends from approximately -0.05 to 0.1, with outliers extending up to 0.5.
* **Random (Red):** The box is centered around 0, with outliers ranging from -0.25 to 0.25.
* **FairPFN (Pink):** The box is centered around 0, with outliers ranging from -0.25 to 0.25.
* **EGR (Purple):** The box is centered around 0, with outliers ranging from -0.25 to 0.25.
* **CFP (Brown):** The box is centered around 0, with outliers ranging from -0.25 to 0.25.
* **Constant (Green):** The box is centered around 0, with outliers ranging from -0.25 to 0.25.
* **Cntf. Avg. (Olive Green):** The box is centered around 0, with outliers ranging from -0.25 to 0.25.
**2. Direct-Effect**
* **Unfair (Blue):** The box extends from approximately 0.1 to 0.4, with outliers extending up to 0.6.
* **Unaware (Orange):** No data present.
* **Random (Red):** The box is centered around 0, with outliers ranging from -0.25 to 0.25.
* **FairPFN (Pink):** No data present.
* **EGR (Purple):** No data present.
* **CFP (Brown):** No data present.
* **Constant (Green):** No data present.
* **Cntf. Avg. (Olive Green):** No data present.
**3. Indirect-Effect**
* **Unfair (Blue):** The box extends from approximately 0.05 to 0.2, with outliers extending up to 0.75.
* **Unaware (Orange):** The box extends from approximately 0 to 0.15, with outliers extending up to 0.4.
* **Random (Red):** The box is centered around 0, with outliers ranging from -0.25 to 0.25.
* **FairPFN (Pink):** The box is centered around 0, with outliers ranging from -0.25 to 0.25.
* **EGR (Purple):** No data present.
* **CFP (Brown):** No data present.
* **Constant (Green):** No data present.
* **Cntf. Avg. (Olive Green):** No data present.
**4. Fair Observable**
* **Unfair (Blue):** The box extends from approximately 0.1 to 0.3, with outliers extending up to 0.7.
* **Unaware (Orange):** The box extends from approximately -0.05 to 0.1, with outliers extending up to 0.25.
* **Random (Red):** The box is centered around 0, with outliers ranging from -0.25 to 0.25.
* **FairPFN (Pink):** The box is centered around 0, with outliers ranging from -0.25 to 0.25.
* **EGR (Purple):** The box is centered around 0, with outliers ranging from -0.25 to 0.25.
* **CFP (Brown):** The box is centered around 0, with outliers ranging from -0.25 to 0.25.
* **Constant (Green):** No data present.
* **Cntf. Avg. (Olive Green):** No data present.
**5. Fair Unobservable**
* **Unfair (Blue):** The box extends from approximately 0.1 to 0.3, with outliers extending up to 0.7.
* **Unaware (Orange):** The box extends from approximately 0 to 0.1, with outliers ranging from -0.25 to 0.25.
* **Random (Red):** The box is centered around 0, with outliers ranging from -0.25 to 0.25.
* **FairPFN (Pink):** The box is centered around 0, with outliers ranging from -0.25 to 0.25.
* **EGR (Purple):** The box is centered around 0, with outliers ranging from -0.25 to 0.25.
* **CFP (Brown):** The box is centered around 0, with outliers ranging from -0.25 to 0.25.
* **Constant (Green):** No data present.
* **Cntf. Avg. (Olive Green):** No data present.
**6. Fair Additive Noise**
* **Unfair (Blue):** The box extends from approximately 0.1 to 0.3, with outliers extending up to 0.75.
* **Unaware (Orange):** The box extends from approximately 0 to 0.1, with outliers extending up to 0.25.
* **Random (Red):** The box is centered around 0, with outliers ranging from -0.25 to 0.25.
* **FairPFN (Pink):** The box is centered around 0, with outliers ranging from -0.25 to 0.25.
* **EGR (Purple):** The box is centered around 0, with outliers ranging from -0.25 to 0.25.
* **CFP (Brown):** The box is centered around 0, with outliers ranging from -0.25 to 0.25.
* **Constant (Green):** No data present.
* **Cntf. Avg. (Olive Green):** No data present.
### Key Observations
* The "Unfair" method (blue) consistently shows a positive causal effect across all scenarios, with the box plots generally located above 0.
* The "Unaware" method (orange) also tends to show a positive causal effect, but to a lesser extent than "Unfair".
* The "Random", "FairPFN", "EGR", "CFP", "Constant", and "Cntf. Avg." methods (red, pink, purple, brown, green, and olive green respectively) generally have box plots centered around 0, indicating a negligible causal effect.
* The "Direct-Effect" scenario has missing data for most methods except "Unfair" and "Random".
### Interpretation
The box plots suggest that the "Unfair" and "Unaware" methods tend to introduce a positive bias in the estimation of the causal effect (ATE). The other methods ("Random", "FairPFN", "EGR", "CFP", "Constant", and "Cntf. Avg.") appear to be less biased, as their distributions are centered around 0. The "Direct-Effect" scenario seems to be a special case, where only the "Unfair" and "Random" methods were evaluated. The average rank (ATE) in the legend supports these observations, with "Unfair" having the highest average rank (5.04), indicating that it is the most biased method on average. The missing data in the "Direct-Effect" scenario and for "Constant" and "Cntf. Avg." in other scenarios might indicate limitations or inapplicability of these methods in those specific situations.
DECODING INTELLIGENCE...