## Box Plot Comparison: Causal Effect (ATE) under Different Fairness Interventions
### Overview
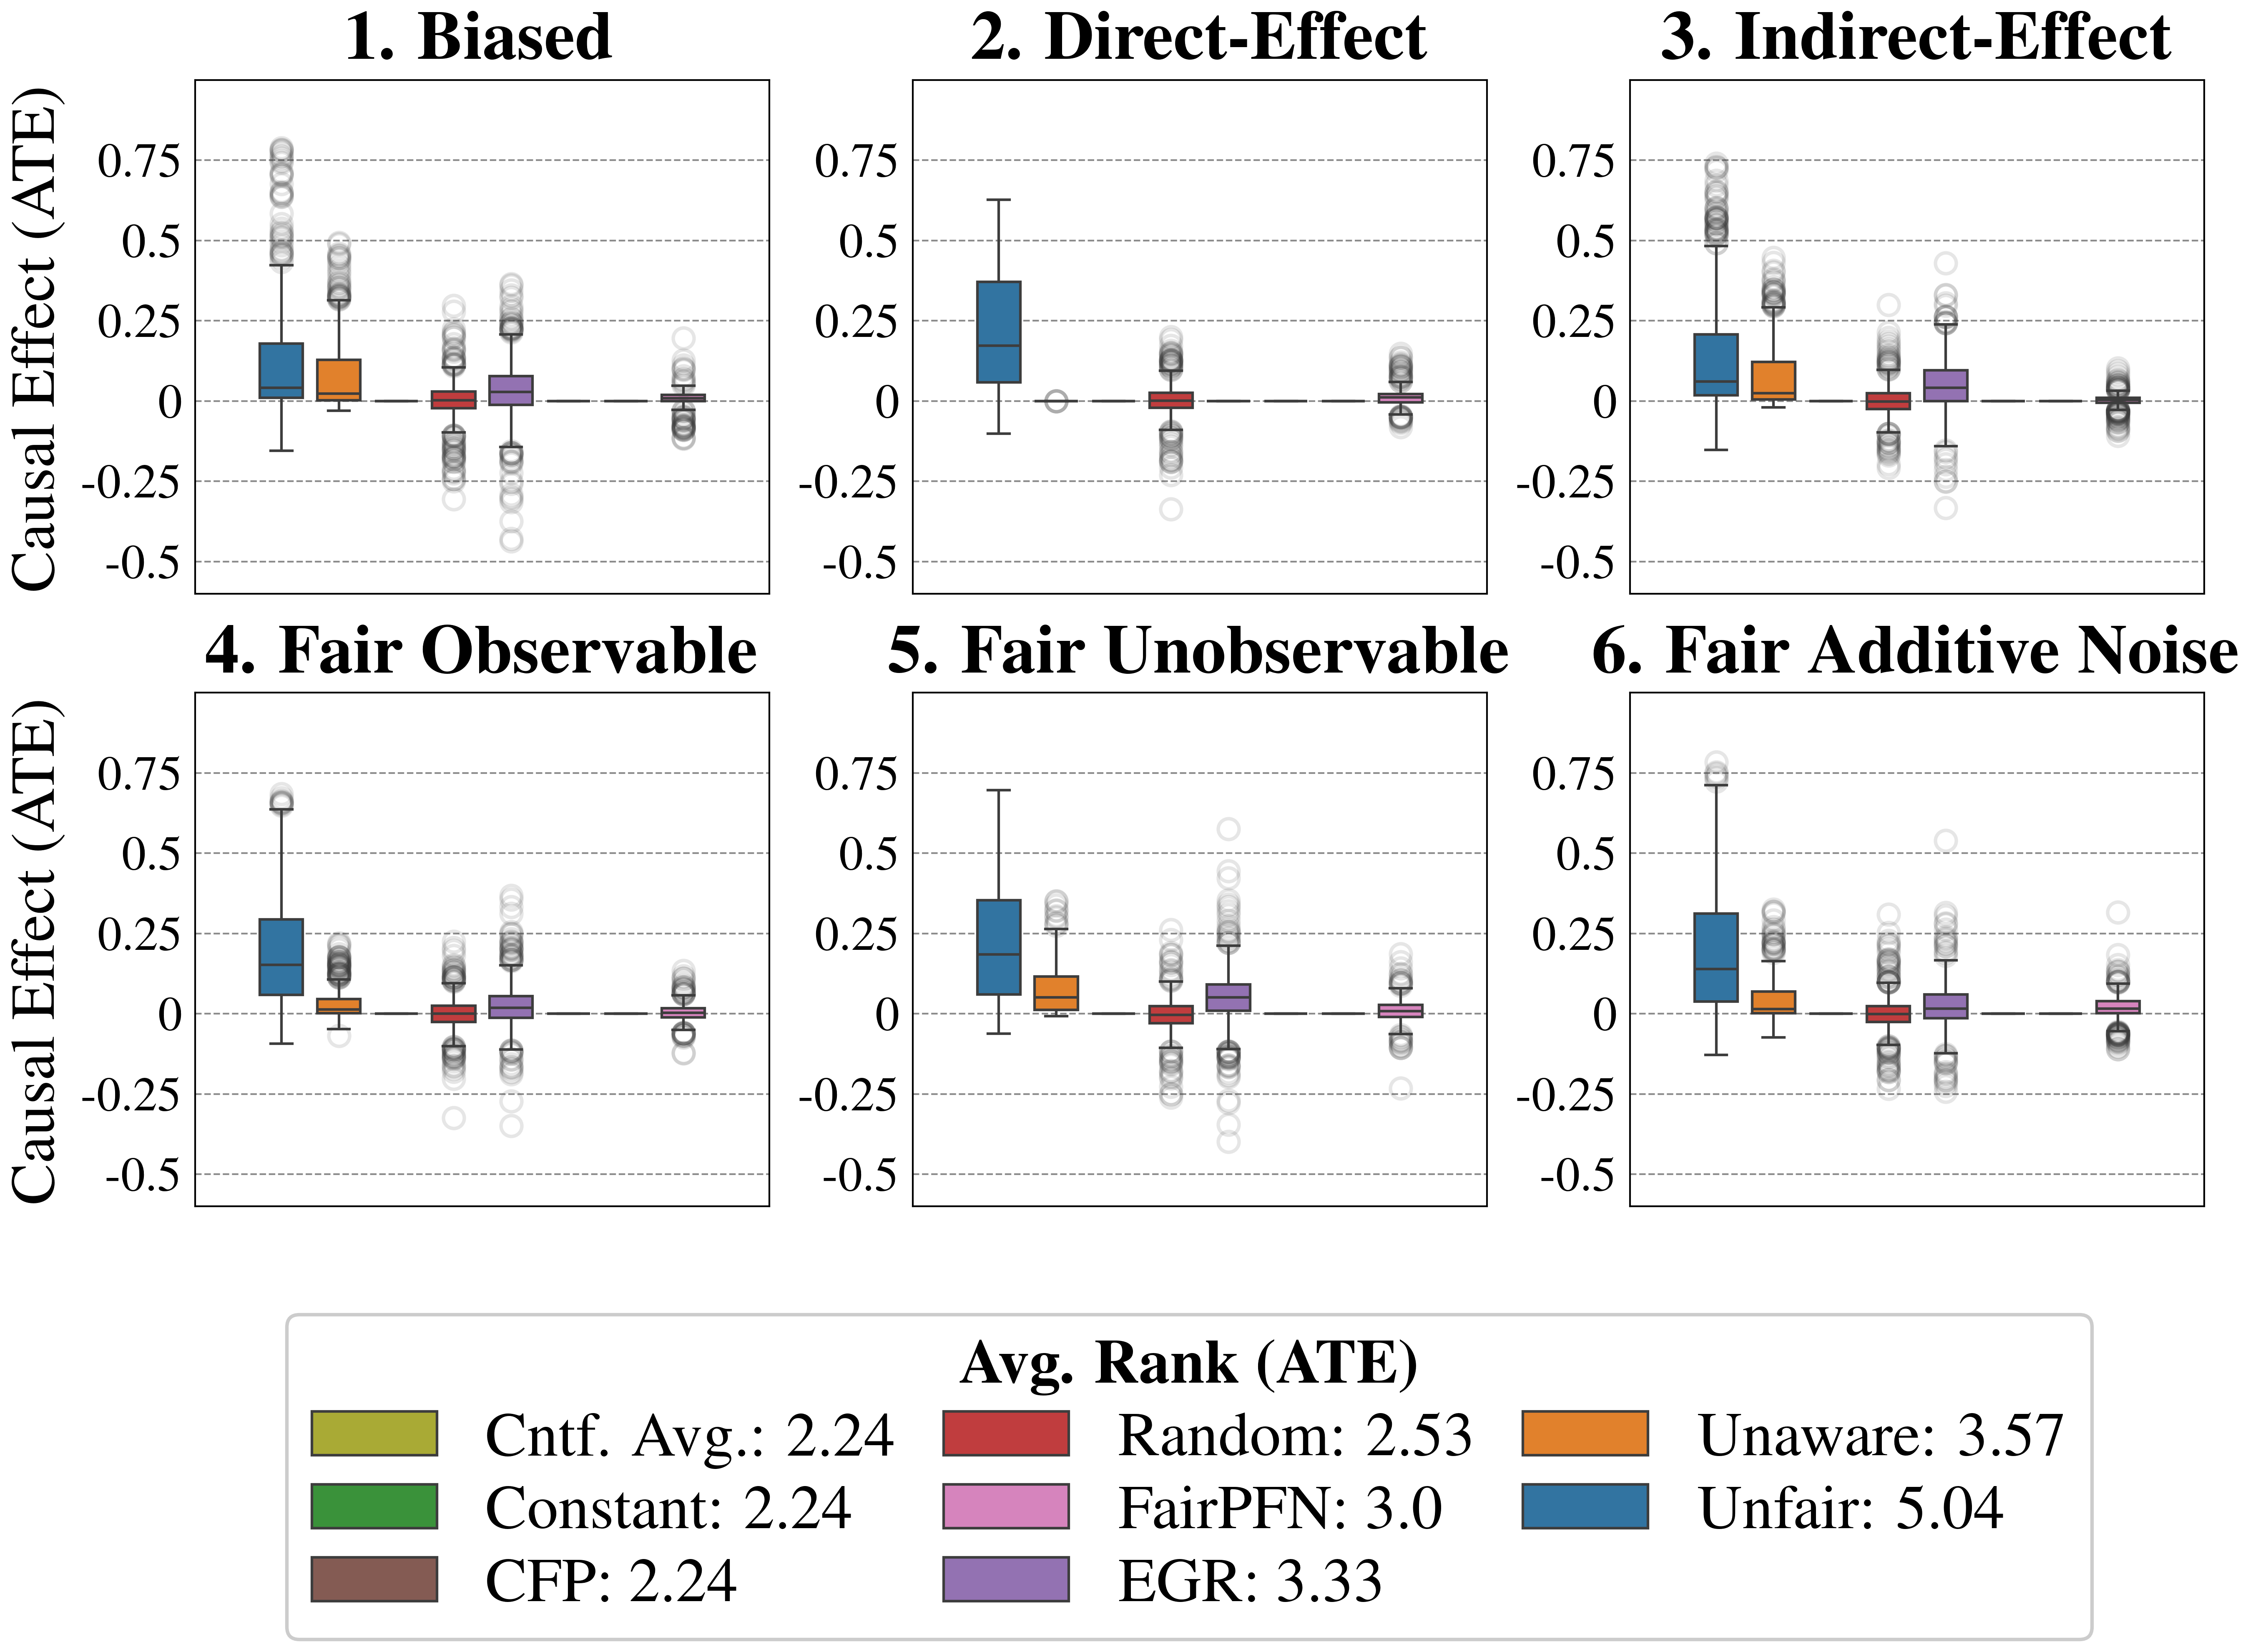
The image presents a 2x3 grid of box plots, each representing the distribution of the Average Treatment Effect (ATE) under different fairness interventions. The interventions are: Biased, Direct-Effect, Indirect-Effect, Fair Observable, Fair Unobservable, and Fair Additive Noise. Each box plot displays the distribution of ATE values, with the y-axis representing the "Causal Effect (ATE)" and the x-axis implicitly representing different samples or trials. A legend at the bottom of the image maps colors to different algorithms or methods used to calculate the ATE. The average rank of each method is also provided.
### Components/Axes
* **Y-axis:** "Causal Effect (ATE)" ranging from -0.5 to 0.75.
* **X-axis:** Implicitly represents different samples or trials for each intervention. No explicit labels are present.
* **Titles:** Each box plot has a numbered title indicating the fairness intervention: 1. Biased, 2. Direct-Effect, 3. Indirect-Effect, 4. Fair Observable, 5. Fair Unobservable, 6. Fair Additive Noise.
* **Legend:** Located at the bottom of the image, mapping colors to algorithms/methods:
* Green: "Cntf. Avg.: 2.24"
* Dark Green: "Constant: 2.24"
* Brown: "CFP: 2.24"
* Orange: "Random: 2.53"
* Purple: "FairPFN: 3.0"
* Dark Purple: "EGR: 3.33"
* Red-Orange: "Unaware: 3.57"
* Blue: "Unfair: 5.04"
### Detailed Analysis
Each box plot shows the distribution of ATE values. The box represents the interquartile range (IQR), the line inside the box represents the median, and the whiskers extend to the most extreme data points within 1.5 times the IQR. Points beyond the whiskers are considered outliers and are plotted individually.
1. **Biased:** The distribution is widely spread, ranging from approximately -0.4 to 0.7. The median is around 0.1. Outliers are present on both ends. Colors present: Green, Dark Green, Brown, Orange, Purple, Dark Purple, Red-Orange, Blue.
2. **Direct-Effect:** The distribution is concentrated around 0, with a narrow IQR. The median is very close to 0. Few outliers are visible. Colors present: Green, Dark Green, Brown, Orange, Purple, Dark Purple, Red-Orange, Blue.
3. **Indirect-Effect:** Similar to "Biased", the distribution is wide, ranging from approximately -0.4 to 0.7. The median is around 0.1. Outliers are present on both ends. Colors present: Green, Dark Green, Brown, Orange, Purple, Dark Purple, Red-Orange, Blue.
4. **Fair Observable:** The distribution is concentrated around 0, with a narrow IQR. The median is very close to 0. Few outliers are visible. Colors present: Green, Dark Green, Brown, Orange, Purple, Dark Purple, Red-Orange, Blue.
5. **Fair Unobservable:** The distribution is wider than "Direct-Effect" and "Fair Observable", ranging from approximately -0.3 to 0.5. The median is around 0.05. Some outliers are visible. Colors present: Green, Dark Green, Brown, Orange, Purple, Dark Purple, Red-Orange, Blue.
6. **Fair Additive Noise:** The distribution is similar to "Fair Observable", concentrated around 0, with a narrow IQR. The median is very close to 0. Few outliers are visible. Colors present: Green, Dark Green, Brown, Orange, Purple, Dark Purple, Red-Orange, Blue.
**Average Rank (ATE):**
* Cntf. Avg.: 2.24
* Constant: 2.24
* CFP: 2.24
* Random: 2.53
* FairPFN: 3.0
* EGR: 3.33
* Unaware: 3.57
* Unfair: 5.04
### Key Observations
* The "Biased" and "Indirect-Effect" interventions exhibit the widest distributions of ATE values, suggesting high variability in causal effects.
* "Direct-Effect", "Fair Observable", and "Fair Additive Noise" interventions show the most concentrated distributions around 0, indicating minimal causal effects.
* "Unfair" has the highest average rank (5.04), indicating the worst performance in terms of fairness.
* "Cntf. Avg.", "Constant", and "CFP" have the lowest average rank (2.24), suggesting better performance.
### Interpretation
The image compares the effectiveness of different fairness interventions in mitigating bias in causal effect estimation. The ATE values represent the average difference in outcomes between groups, and the goal of fairness interventions is to reduce or eliminate these differences.
The results suggest that the "Direct-Effect", "Fair Observable", and "Fair Additive Noise" interventions are most effective at reducing causal effects, as evidenced by their concentrated distributions around 0. This implies that these interventions successfully remove or mitigate the influence of sensitive attributes on the estimated treatment effects.
The "Biased" and "Indirect-Effect" interventions, on the other hand, exhibit high variability in ATE values, indicating that they are less effective at achieving fairness. The "Unfair" intervention has the highest average rank, confirming its poor performance.
The average rank values provide a quantitative measure of the effectiveness of each intervention, with lower ranks indicating better performance. The fact that "Cntf. Avg.", "Constant", and "CFP" have the lowest ranks suggests that these methods are promising approaches for achieving fairness in causal inference.
The presence of outliers in some of the box plots suggests that there may be specific cases where the interventions are less effective or even detrimental. Further investigation is needed to understand the reasons for these outliers and to develop more robust fairness interventions.