## Bar Chart: Distribution of the Number of Generated Sub-questions per Dataset (MetaQA)
### Overview
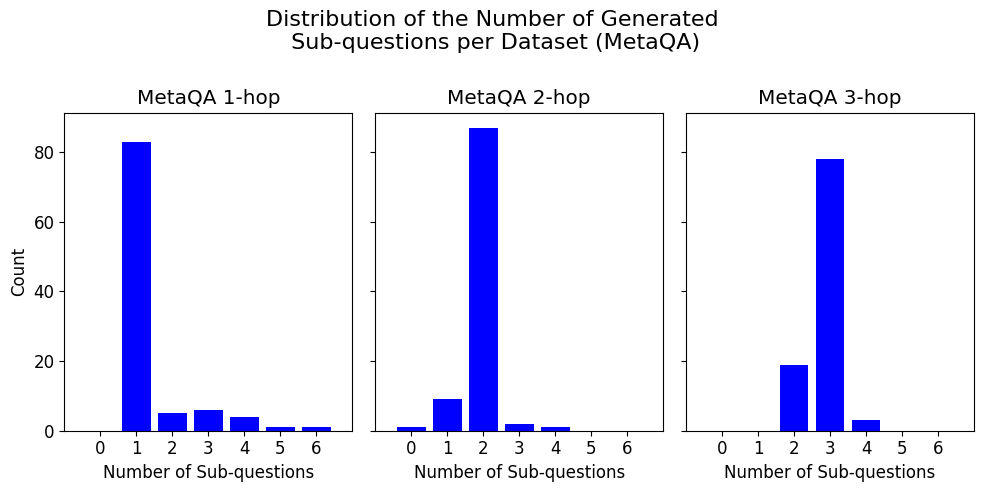
The image presents three bar charts, each displaying the distribution of the number of generated sub-questions for different MetaQA datasets: 1-hop, 2-hop, and 3-hop. The x-axis represents the number of sub-questions, ranging from 0 to 6, and the y-axis represents the count or frequency of each number of sub-questions. All bars are blue.
### Components/Axes
* **Title:** Distribution of the Number of Generated Sub-questions per Dataset (MetaQA)
* **X-axis Title:** Number of Sub-questions
* **Y-axis Title:** Count
* **Y-axis Scale:** 0 to 80, with tick marks at 20, 40, 60, and 80.
* **X-axis Scale:** 0 to 6, with tick marks at each integer value.
* **Subplots:**
* MetaQA 1-hop (left)
* MetaQA 2-hop (center)
* MetaQA 3-hop (right)
### Detailed Analysis
**MetaQA 1-hop:**
* The bar representing 0 sub-questions has a count of approximately 82.
* The bar representing 1 sub-question has a count of approximately 5.
* The bar representing 2 sub-questions has a count of approximately 6.
* The bar representing 3 sub-questions has a count of approximately 6.
* The bar representing 4 sub-questions has a count of approximately 4.
* The bar representing 5 sub-questions has a count of approximately 2.
* The bar representing 6 sub-questions has a count of approximately 1.
**MetaQA 2-hop:**
* The bar representing 0 sub-questions has a count of approximately 1.
* The bar representing 1 sub-question has a count of approximately 9.
* The bar representing 2 sub-questions has a count of approximately 86.
* The bar representing 3 sub-questions has a count of approximately 2.
* The bar representing 4 sub-questions has a count of approximately 1.
* The bar representing 5 sub-questions has a count of approximately 0.
* The bar representing 6 sub-questions has a count of approximately 0.
**MetaQA 3-hop:**
* The bar representing 0 sub-questions has a count of approximately 0.
* The bar representing 1 sub-question has a count of approximately 2.
* The bar representing 2 sub-questions has a count of approximately 19.
* The bar representing 3 sub-questions has a count of approximately 79.
* The bar representing 4 sub-questions has a count of approximately 3.
* The bar representing 5 sub-questions has a count of approximately 0.
* The bar representing 6 sub-questions has a count of approximately 0.
### Key Observations
* In MetaQA 1-hop, the majority of questions require 0 sub-questions.
* In MetaQA 2-hop, the majority of questions require 2 sub-questions.
* In MetaQA 3-hop, the majority of questions require 3 sub-questions.
* The distribution shifts towards higher numbers of sub-questions as the hop count increases.
### Interpretation
The charts illustrate the relationship between the complexity of questions (measured by hop count) and the number of sub-questions needed to answer them. As the hop count increases from 1 to 3, the distribution of the number of sub-questions shifts towards higher values. This suggests that more complex questions (higher hop count) require a greater number of sub-questions to be answered effectively. The data demonstrates that the MetaQA dataset is structured in a way that reflects the increasing complexity of questions as the hop count increases. The concentration of counts at 0, 2, and 3 sub-questions for 1-hop, 2-hop, and 3-hop questions, respectively, indicates a clear correlation between hop count and the optimal number of sub-questions.