## Generalization Error vs. Gradient Updates Chart
### Overview
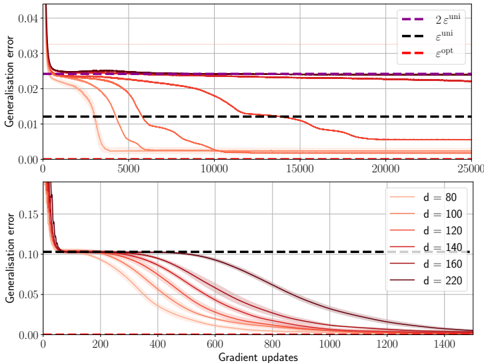
The image contains two line charts displaying the generalization error as a function of gradient updates. The top chart shows the generalization error for different theoretical bounds, while the bottom chart shows the generalization error for different values of 'd' (likely representing model complexity or dimensionality).
### Components/Axes
**Top Chart:**
* **Y-axis:** Generalisation error, ranging from 0.00 to 0.04.
* **X-axis:** Gradient updates, ranging from 0 to 25000.
* **Legend (Top-Right):**
* Purple dashed line: "2 ε<sup>uni</sup>"
* Black dashed line: "ε<sup>uni</sup>"
* Red dashed line: "ε<sup>opt</sup>"
**Bottom Chart:**
* **Y-axis:** Generalisation error, ranging from 0.00 to 0.15.
* **X-axis:** Gradient updates, ranging from 0 to 1400.
* **Legend (Right):**
* Light red line: d = 80
* Red line: d = 100
* Dark red line: d = 120
* Gray dashed line: d = 140
* Light gray line: d = 160
* Dark gray line: d = 220
### Detailed Analysis
**Top Chart:**
* **2 ε<sup>uni</sup> (Purple Dashed):** A horizontal line at approximately 0.024, indicating a constant error bound.
* **ε<sup>uni</sup> (Black Dashed):** A horizontal line at approximately 0.012, indicating a constant error bound.
* **ε<sup>opt</sup> (Red Dashed):** Starts at approximately 0.04, rapidly decreases to approximately 0.024, then gradually decreases to approximately 0.002.
**Bottom Chart:**
* **d = 80 (Light Red):** Starts at approximately 0.15, decreases to approximately 0.00 after about 600 gradient updates.
* **d = 100 (Red):** Starts at approximately 0.15, decreases to approximately 0.00 after about 700 gradient updates.
* **d = 120 (Dark Red):** Starts at approximately 0.15, decreases to approximately 0.00 after about 800 gradient updates.
* **d = 140 (Gray Dashed):** Starts at approximately 0.15, decreases to approximately 0.00 after about 900 gradient updates.
* **d = 160 (Light Gray):** Starts at approximately 0.15, decreases to approximately 0.00 after about 1000 gradient updates.
* **d = 220 (Dark Gray):** Starts at approximately 0.15, decreases to approximately 0.00 after about 1200 gradient updates.
### Key Observations
* In the top chart, the theoretical error bounds (2 ε<sup>uni</sup> and ε<sup>uni</sup>) remain constant, while the optimized error (ε<sup>opt</sup>) decreases with gradient updates.
* In the bottom chart, as the value of 'd' increases, the number of gradient updates required to reach a generalization error of approximately 0.00 also increases.
### Interpretation
The top chart illustrates the difference between theoretical error bounds and the actual optimized error during training. The constant theoretical bounds suggest a fixed upper limit on the error, while the decreasing optimized error shows the model's learning progress.
The bottom chart demonstrates the impact of model complexity ('d') on the training process. Higher values of 'd' (more complex models) require more gradient updates to achieve a similar level of generalization error. This suggests that more complex models may need more training data or iterations to converge to an optimal solution. The trend indicates a trade-off between model complexity and training efficiency.